Financial Data
Financial Highlights
| Consolidated financial results (JGAAP) | FY2022 (Actual) |
FY2023 (Actual) |
FY2024 (Actual) |
FY2025 (Actual) |
FY2026 (Forecast) |
|---|---|---|---|---|---|
|
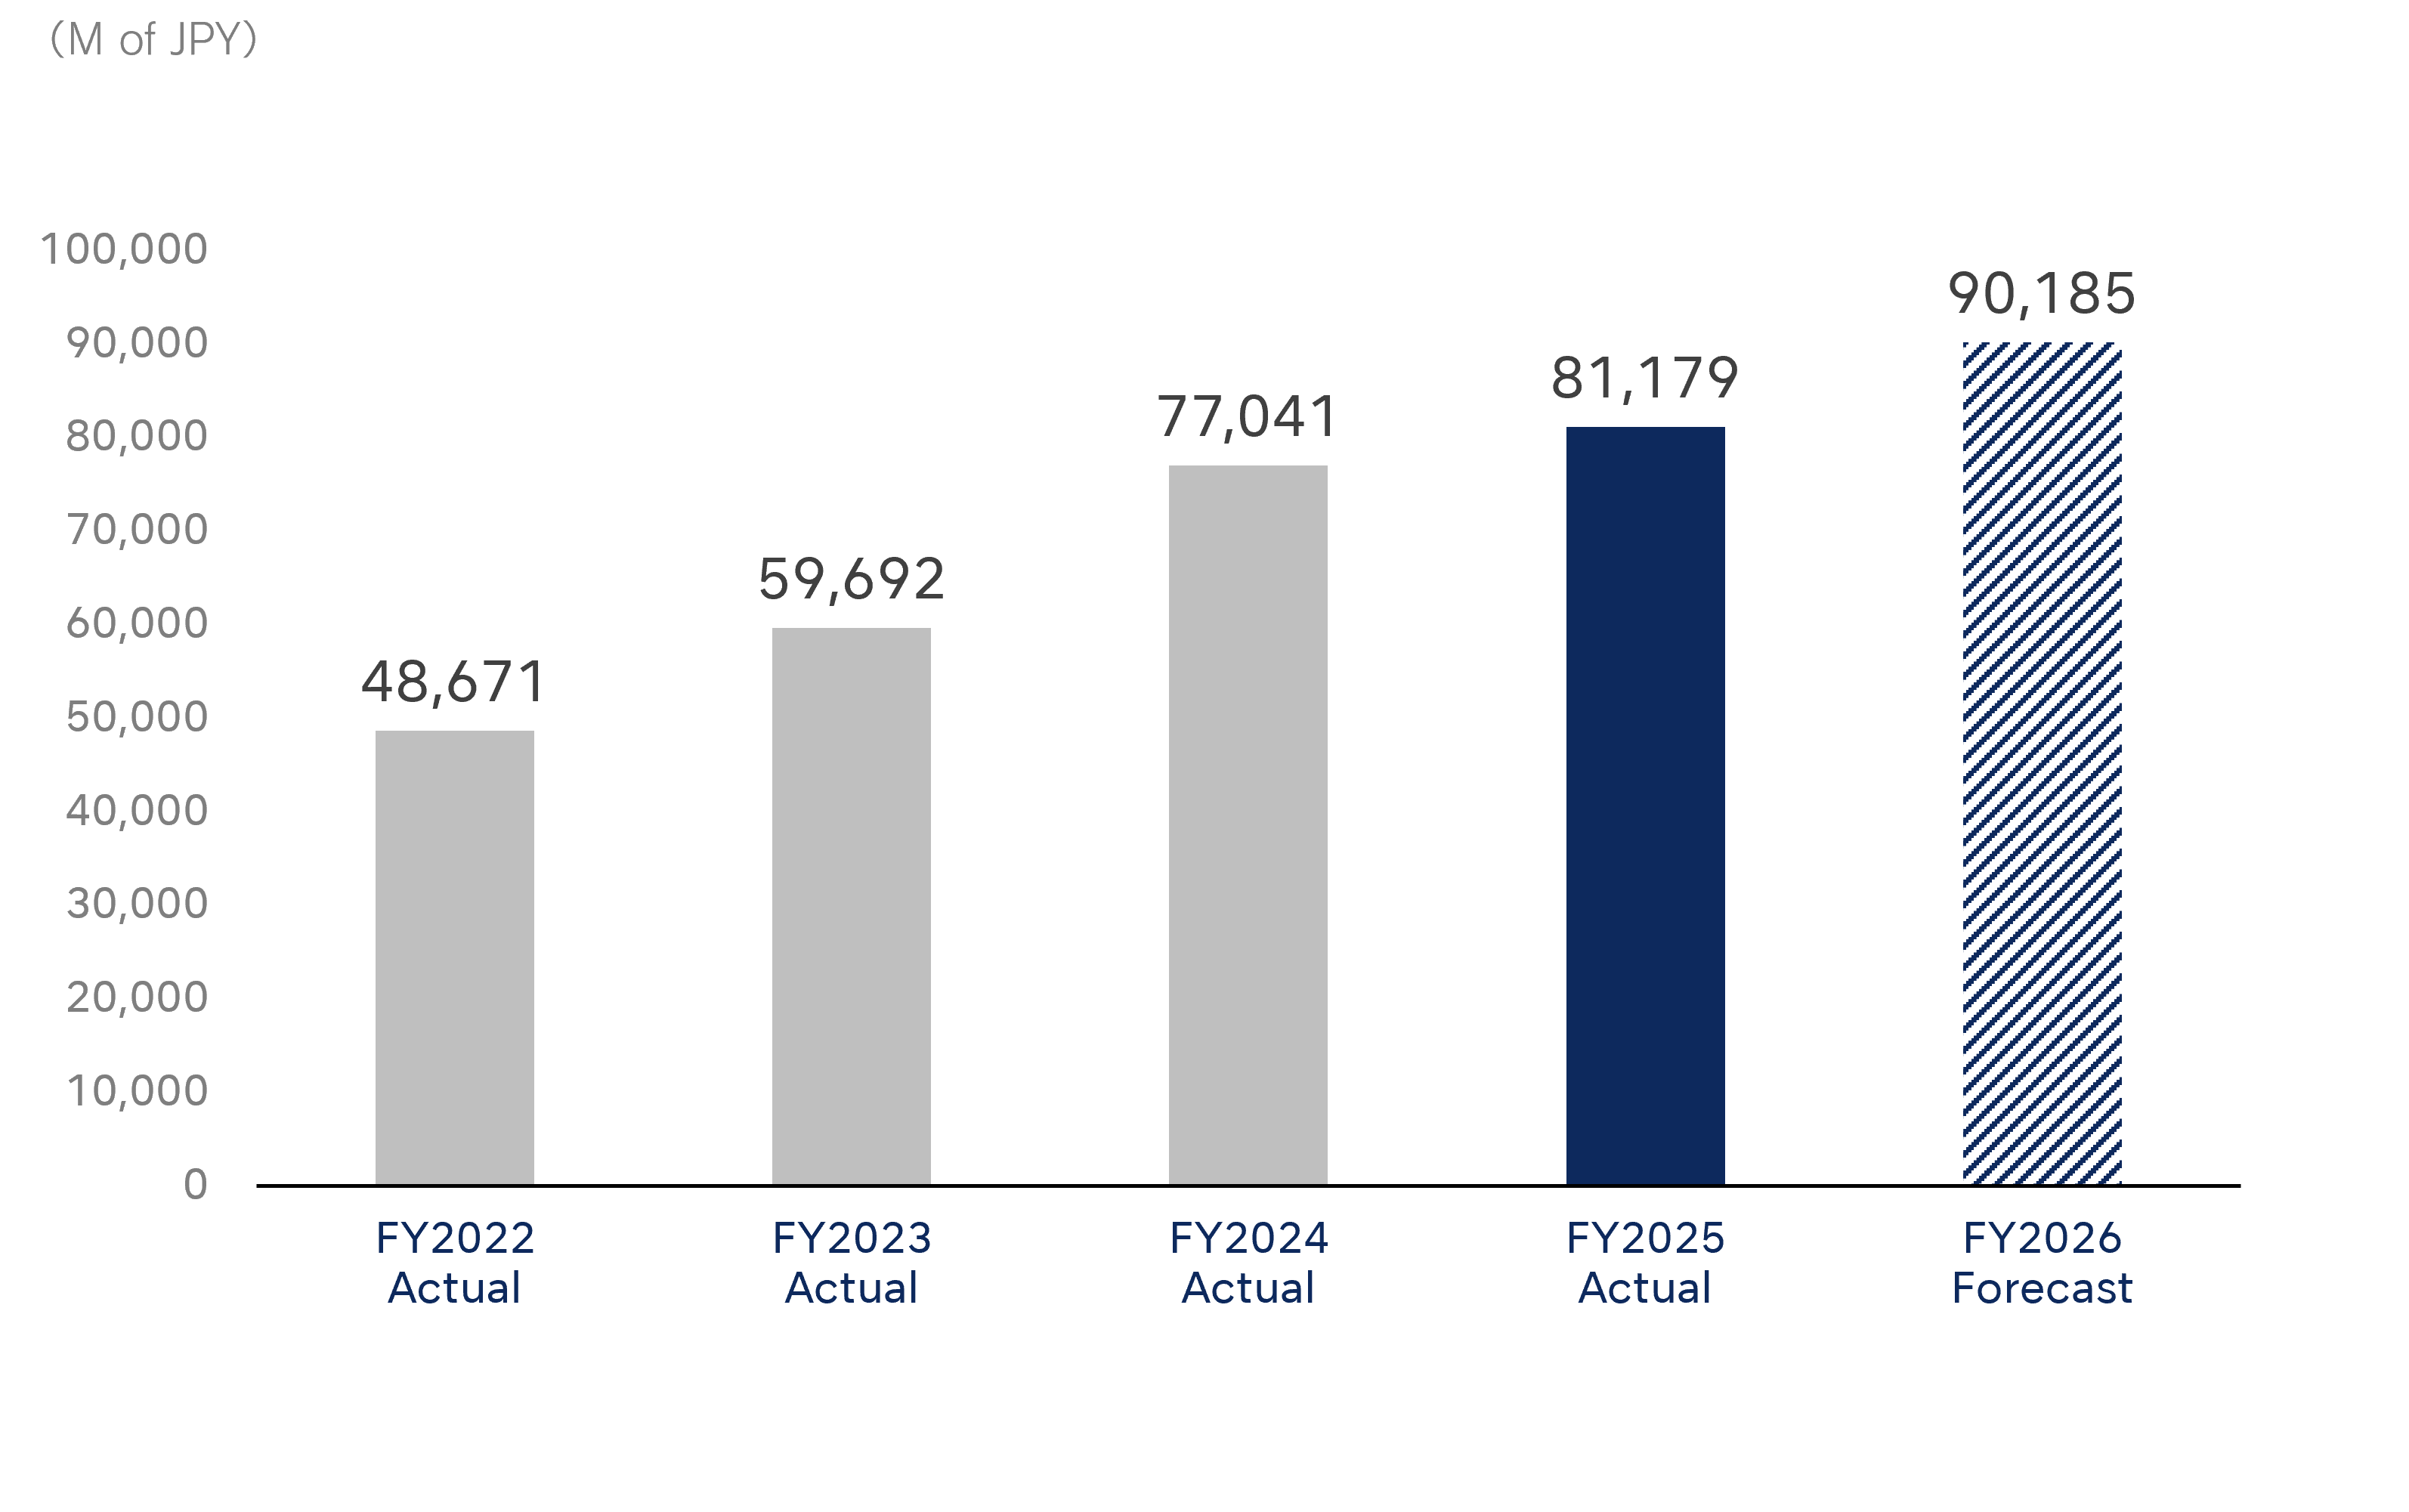
Net salesMillions of JPY |
48,671 | 59,692 | 77,041 | 81,179 | 90,185 |
|
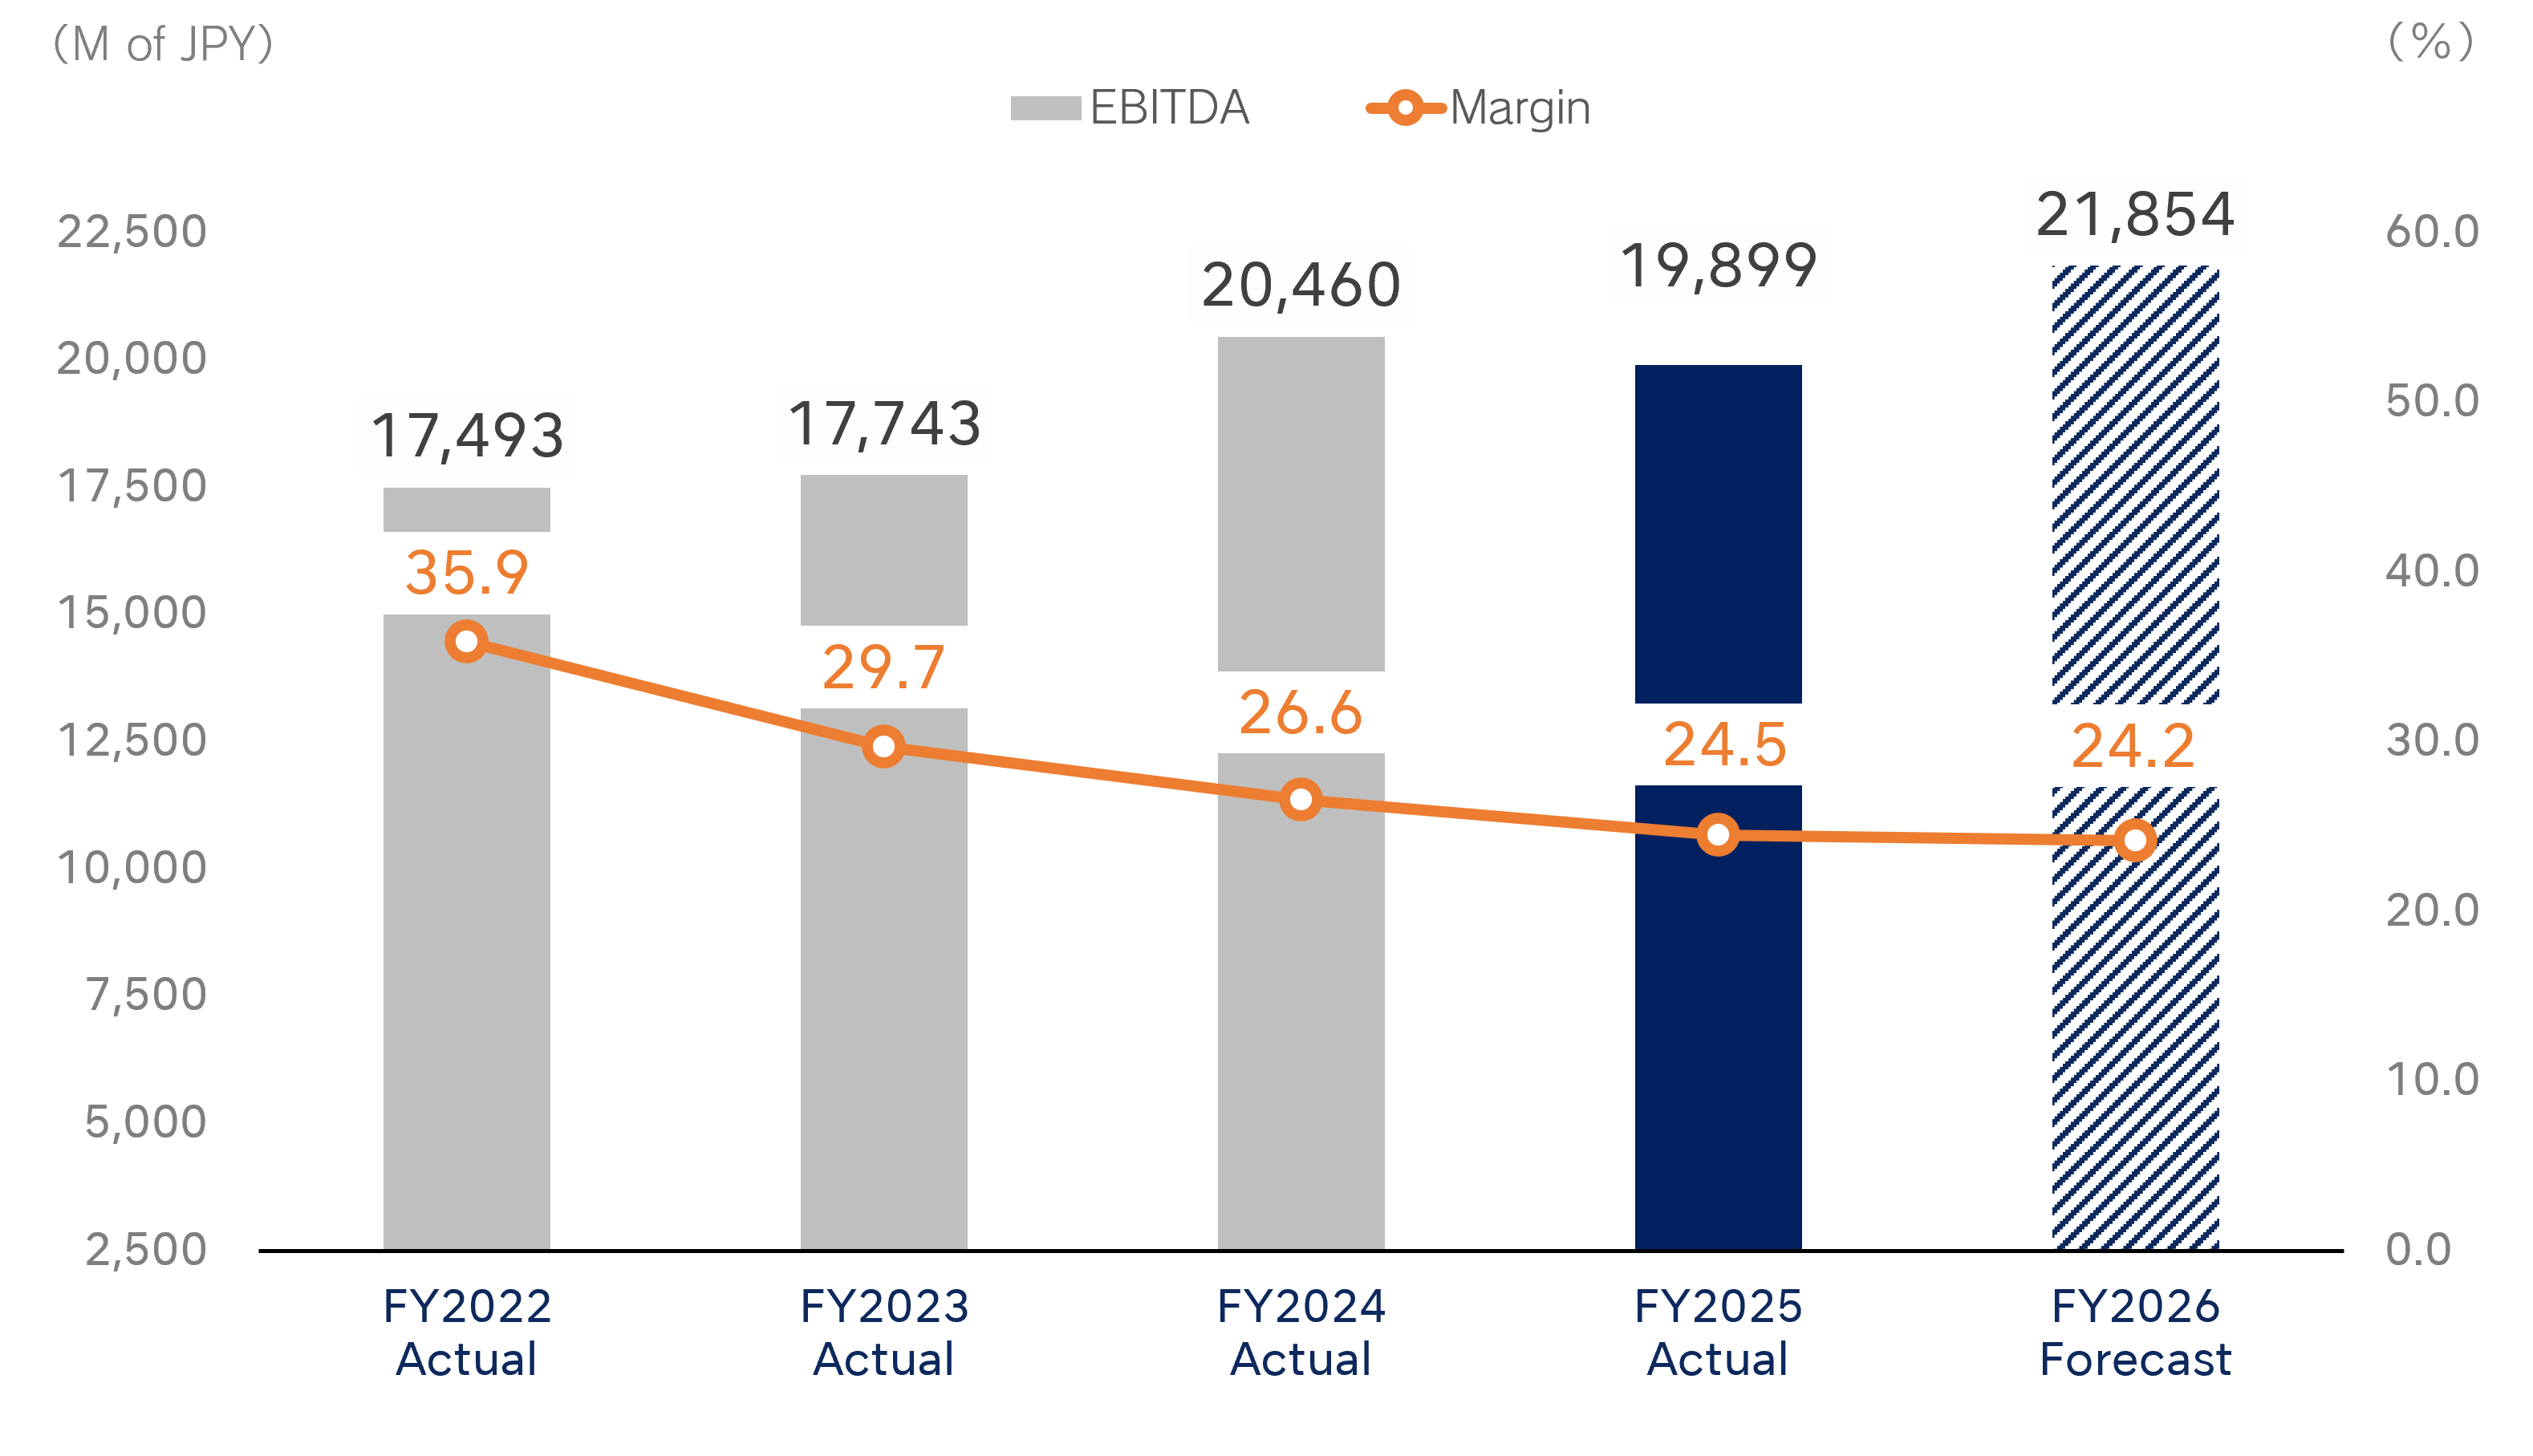
EBITDAMillions of JPY |
17,493 | 17,743 | 20,460 | 19,899 | 21,854 |
|
EBITDA Margin % |
35.9 | 29.7 | 26.6 | 24.5 | 24.2 |
|
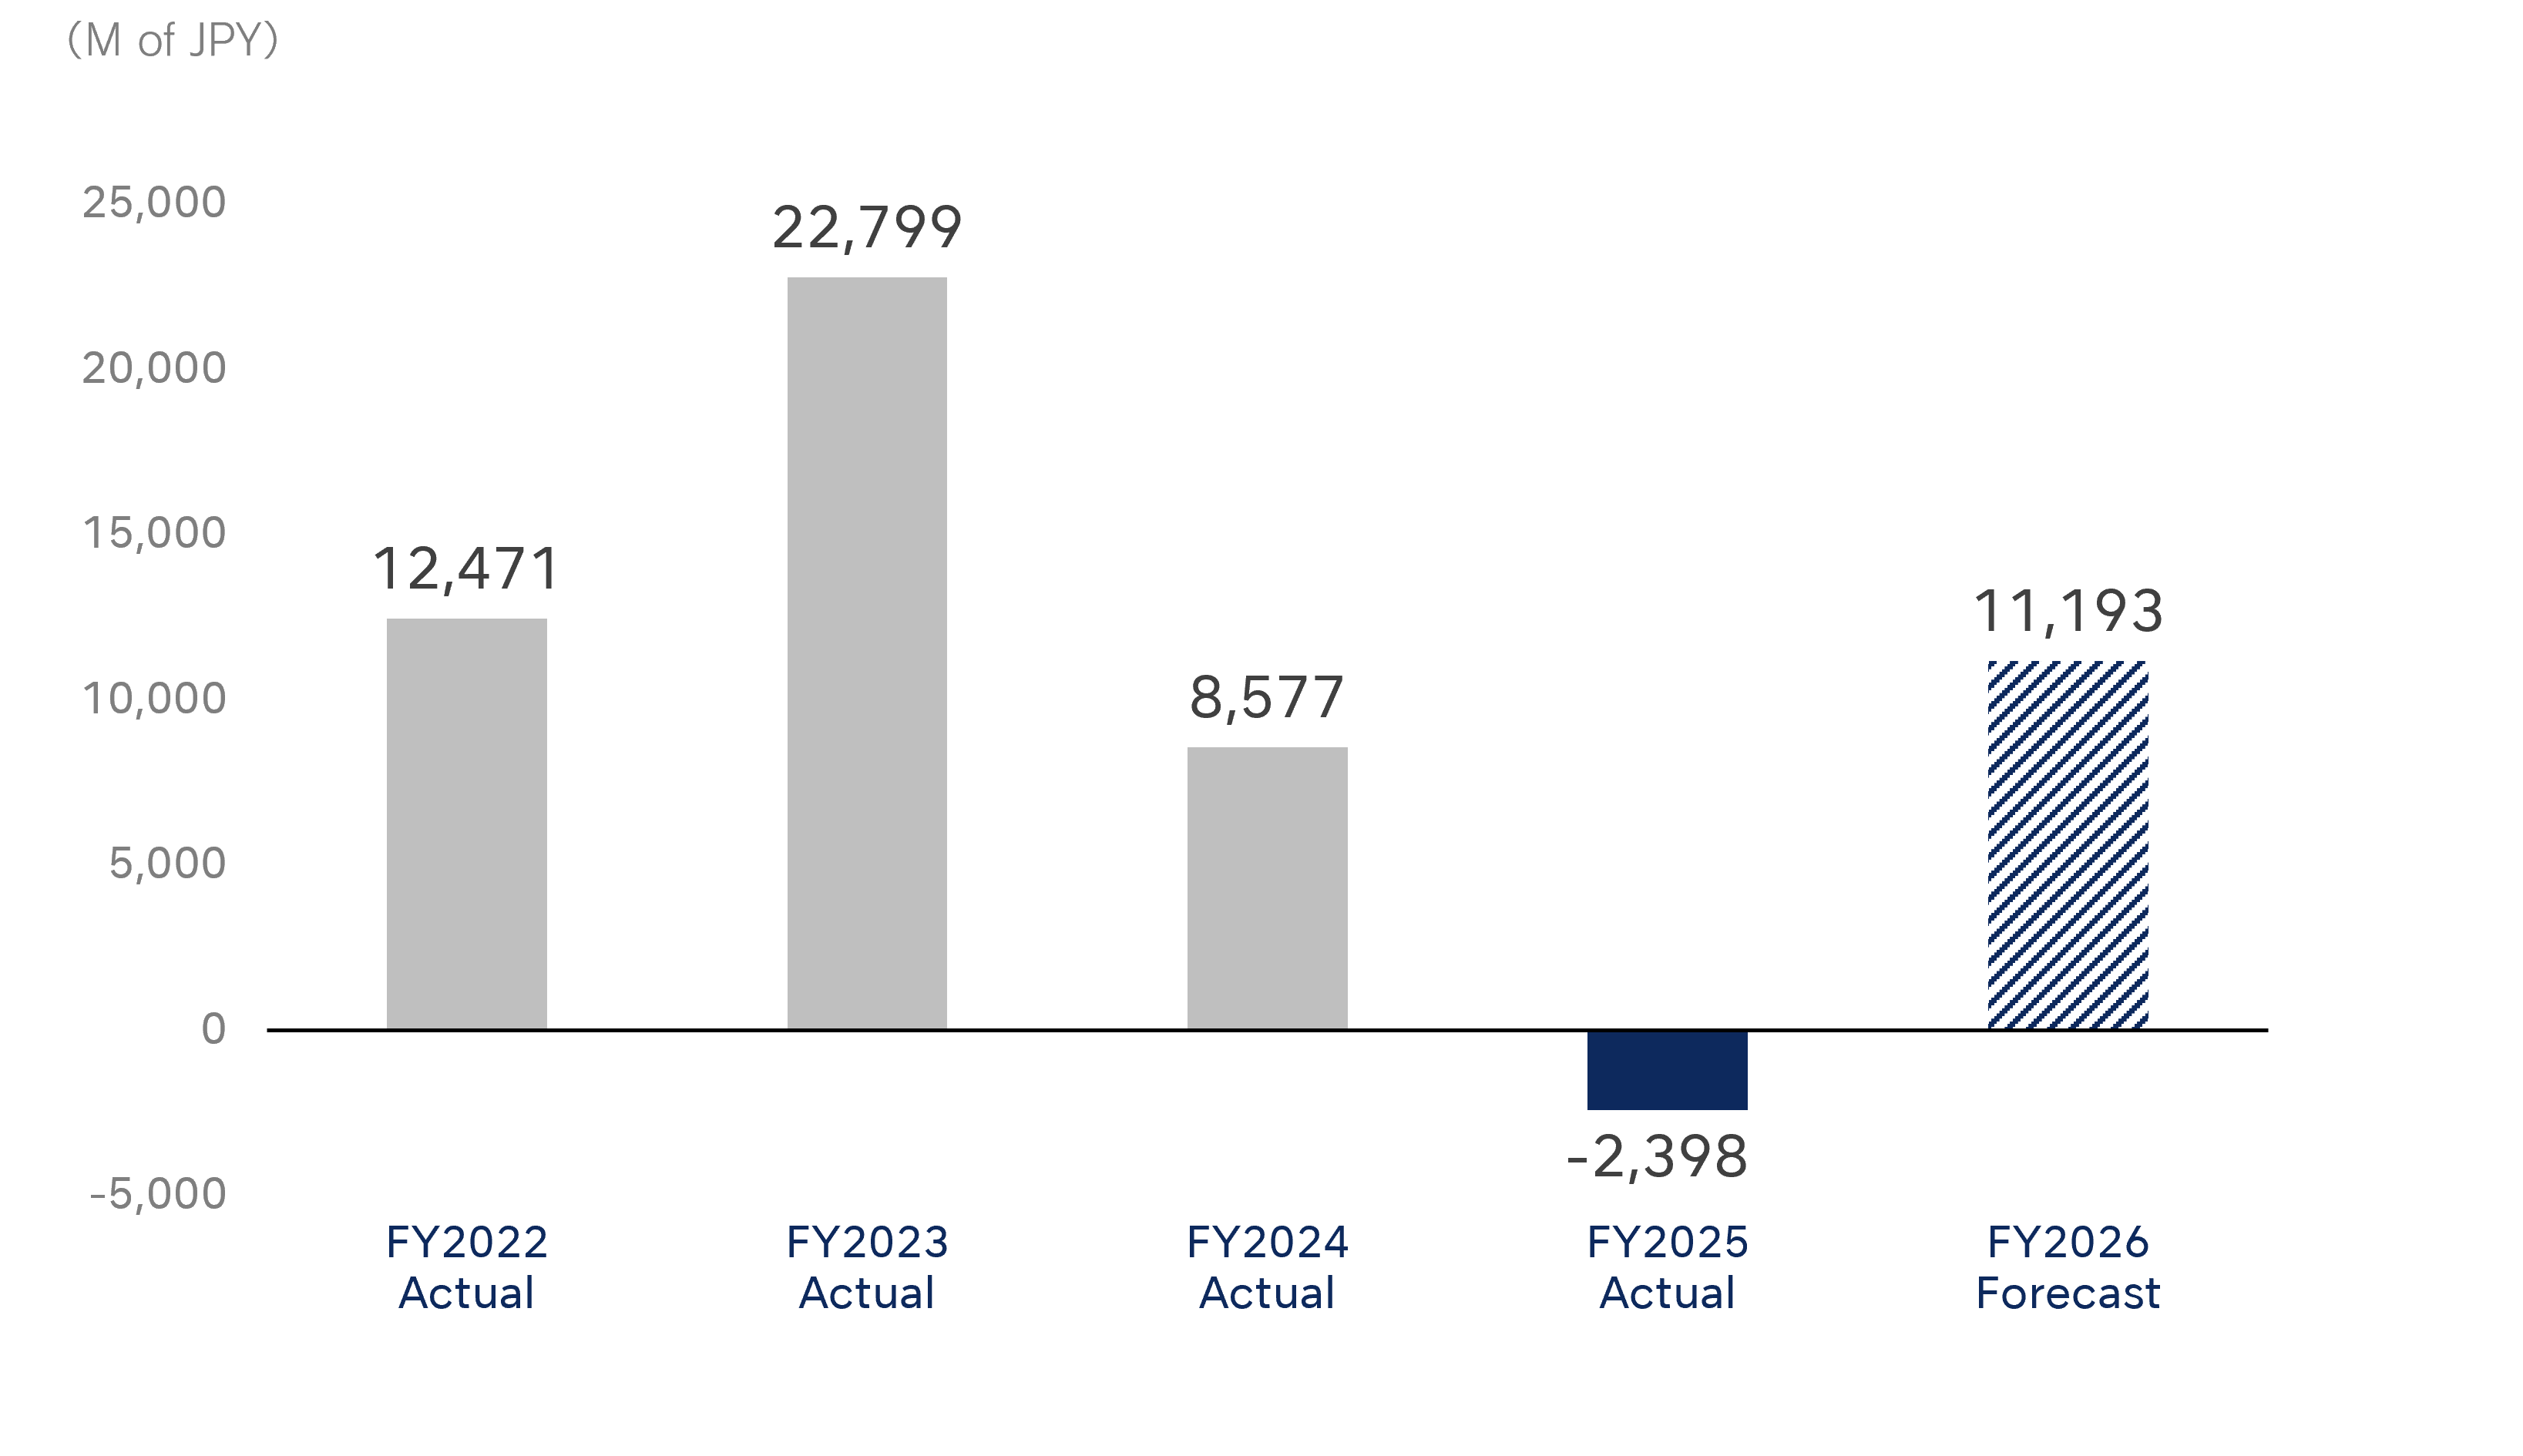
Profit attributable to owners of parentMillions of JPY |
12,471 | 22,799 | 8,577 | -2,398 | 11,193 |
|
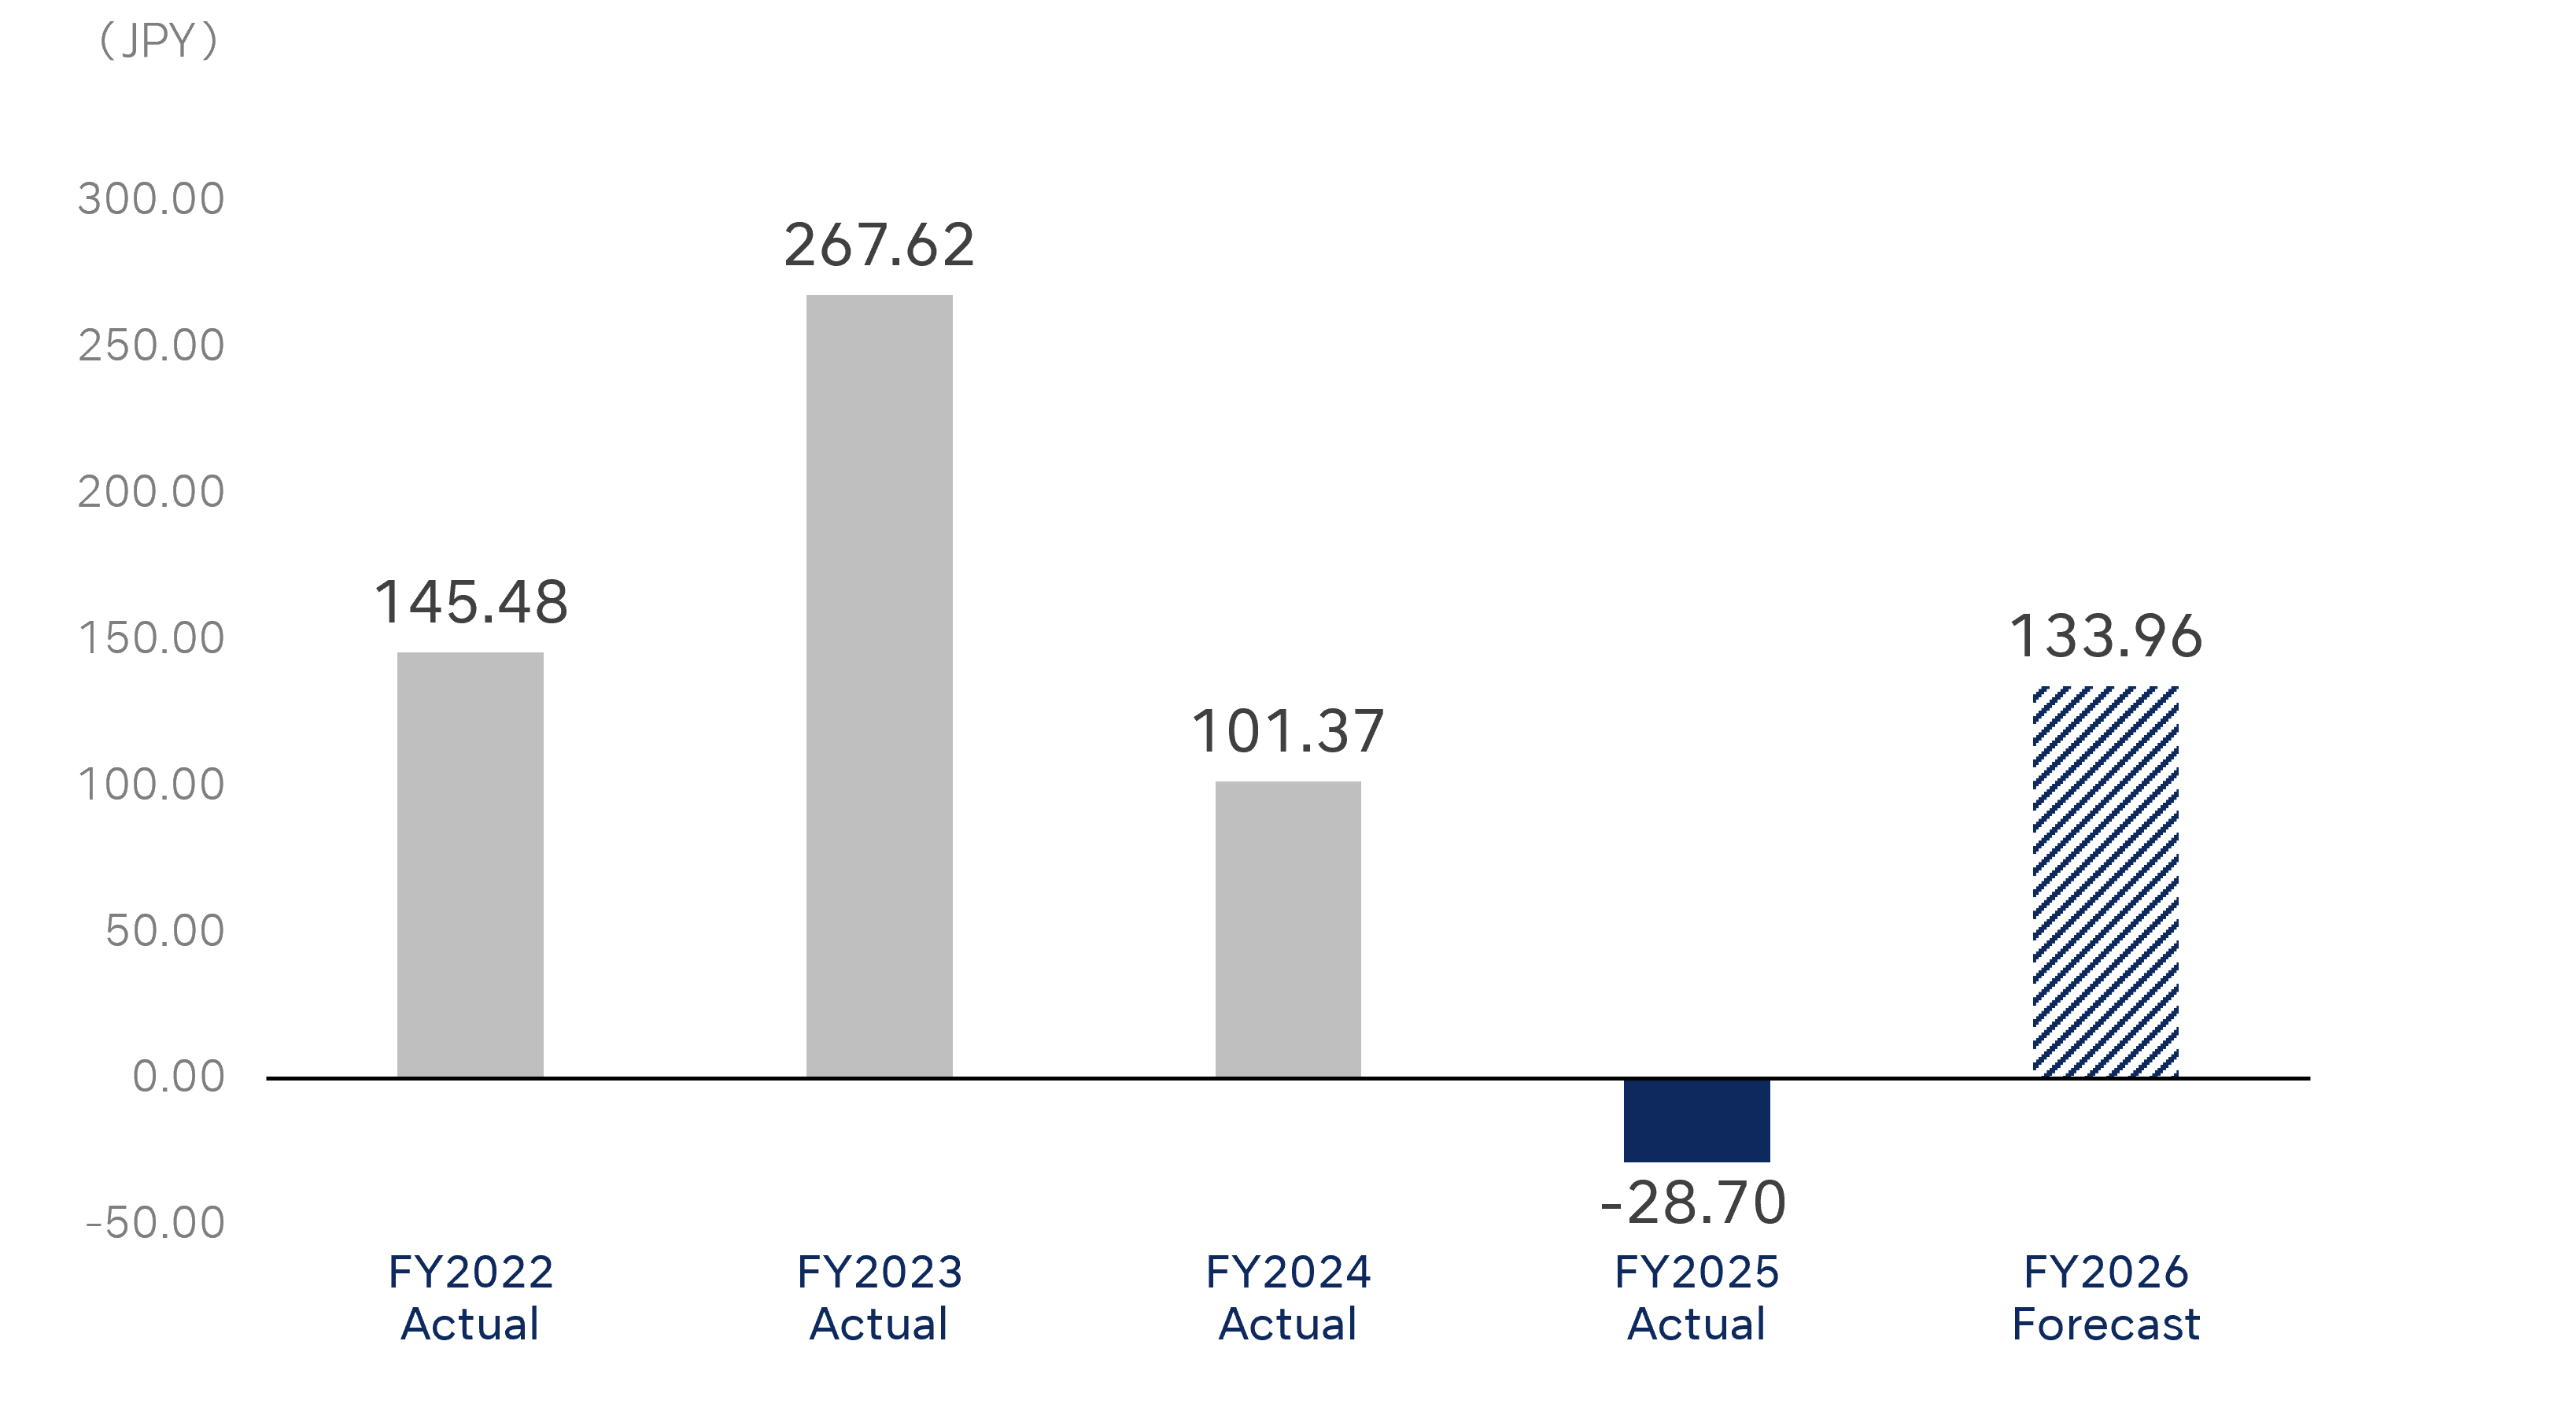
Earnings per share JPY |
145.48 | 267.62 | 101.37 | -28.70 | 133.96 |
Net sales
EBITDA / Margin
Profit attributable to owners of parent
Earnings per share
Key Financial Data
| Consolidated financial results (JGAAP) | FY2021 Actual |
FY2022 Actual |
FY2023 Actual |
FY2024 Actual |
FY2025 Actual |
|---|---|---|---|---|---|
|
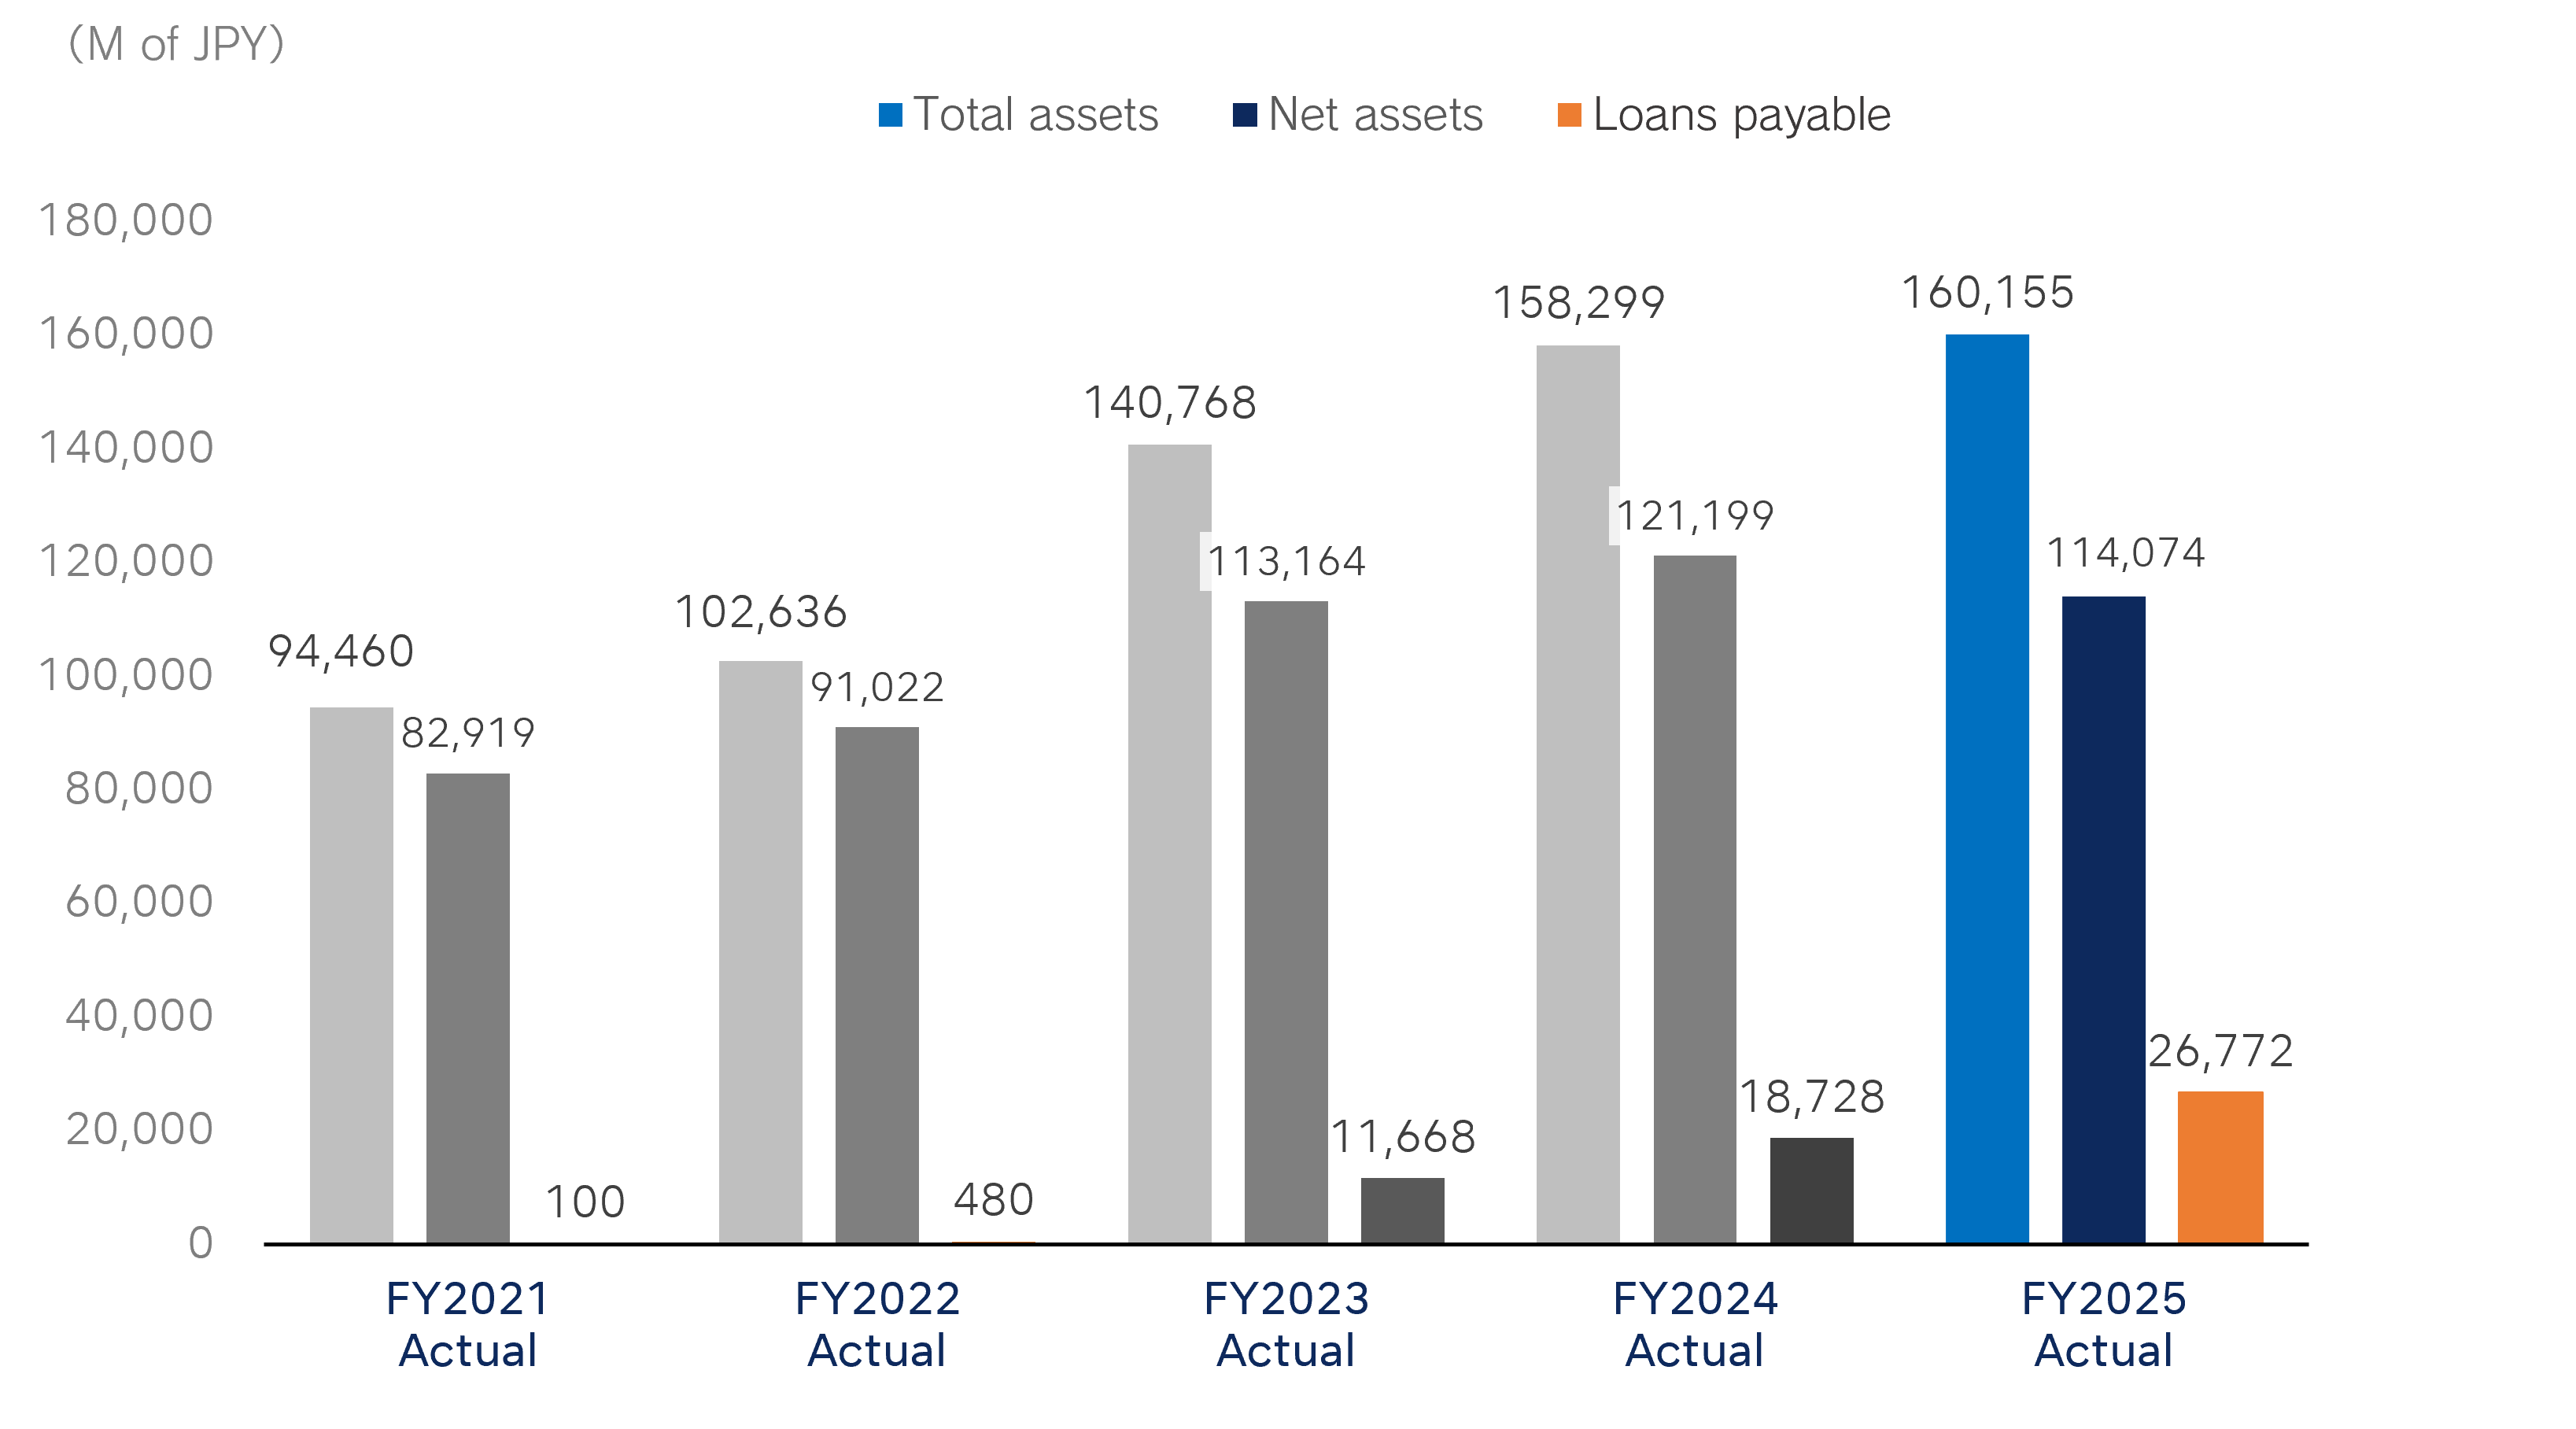
Total assetsMillions of JPY |
94,460 | 102,636 | 140,768 | 158,299 | 160,155 |
|
Net assetsMillions of JPY |
82,919 | 91,022 | 113,164 | 121,199 | 114,074 |
|
Loans payableMillions of JPY |
100 | 480 | 11,668 | 18,728 | 26,772 |
|
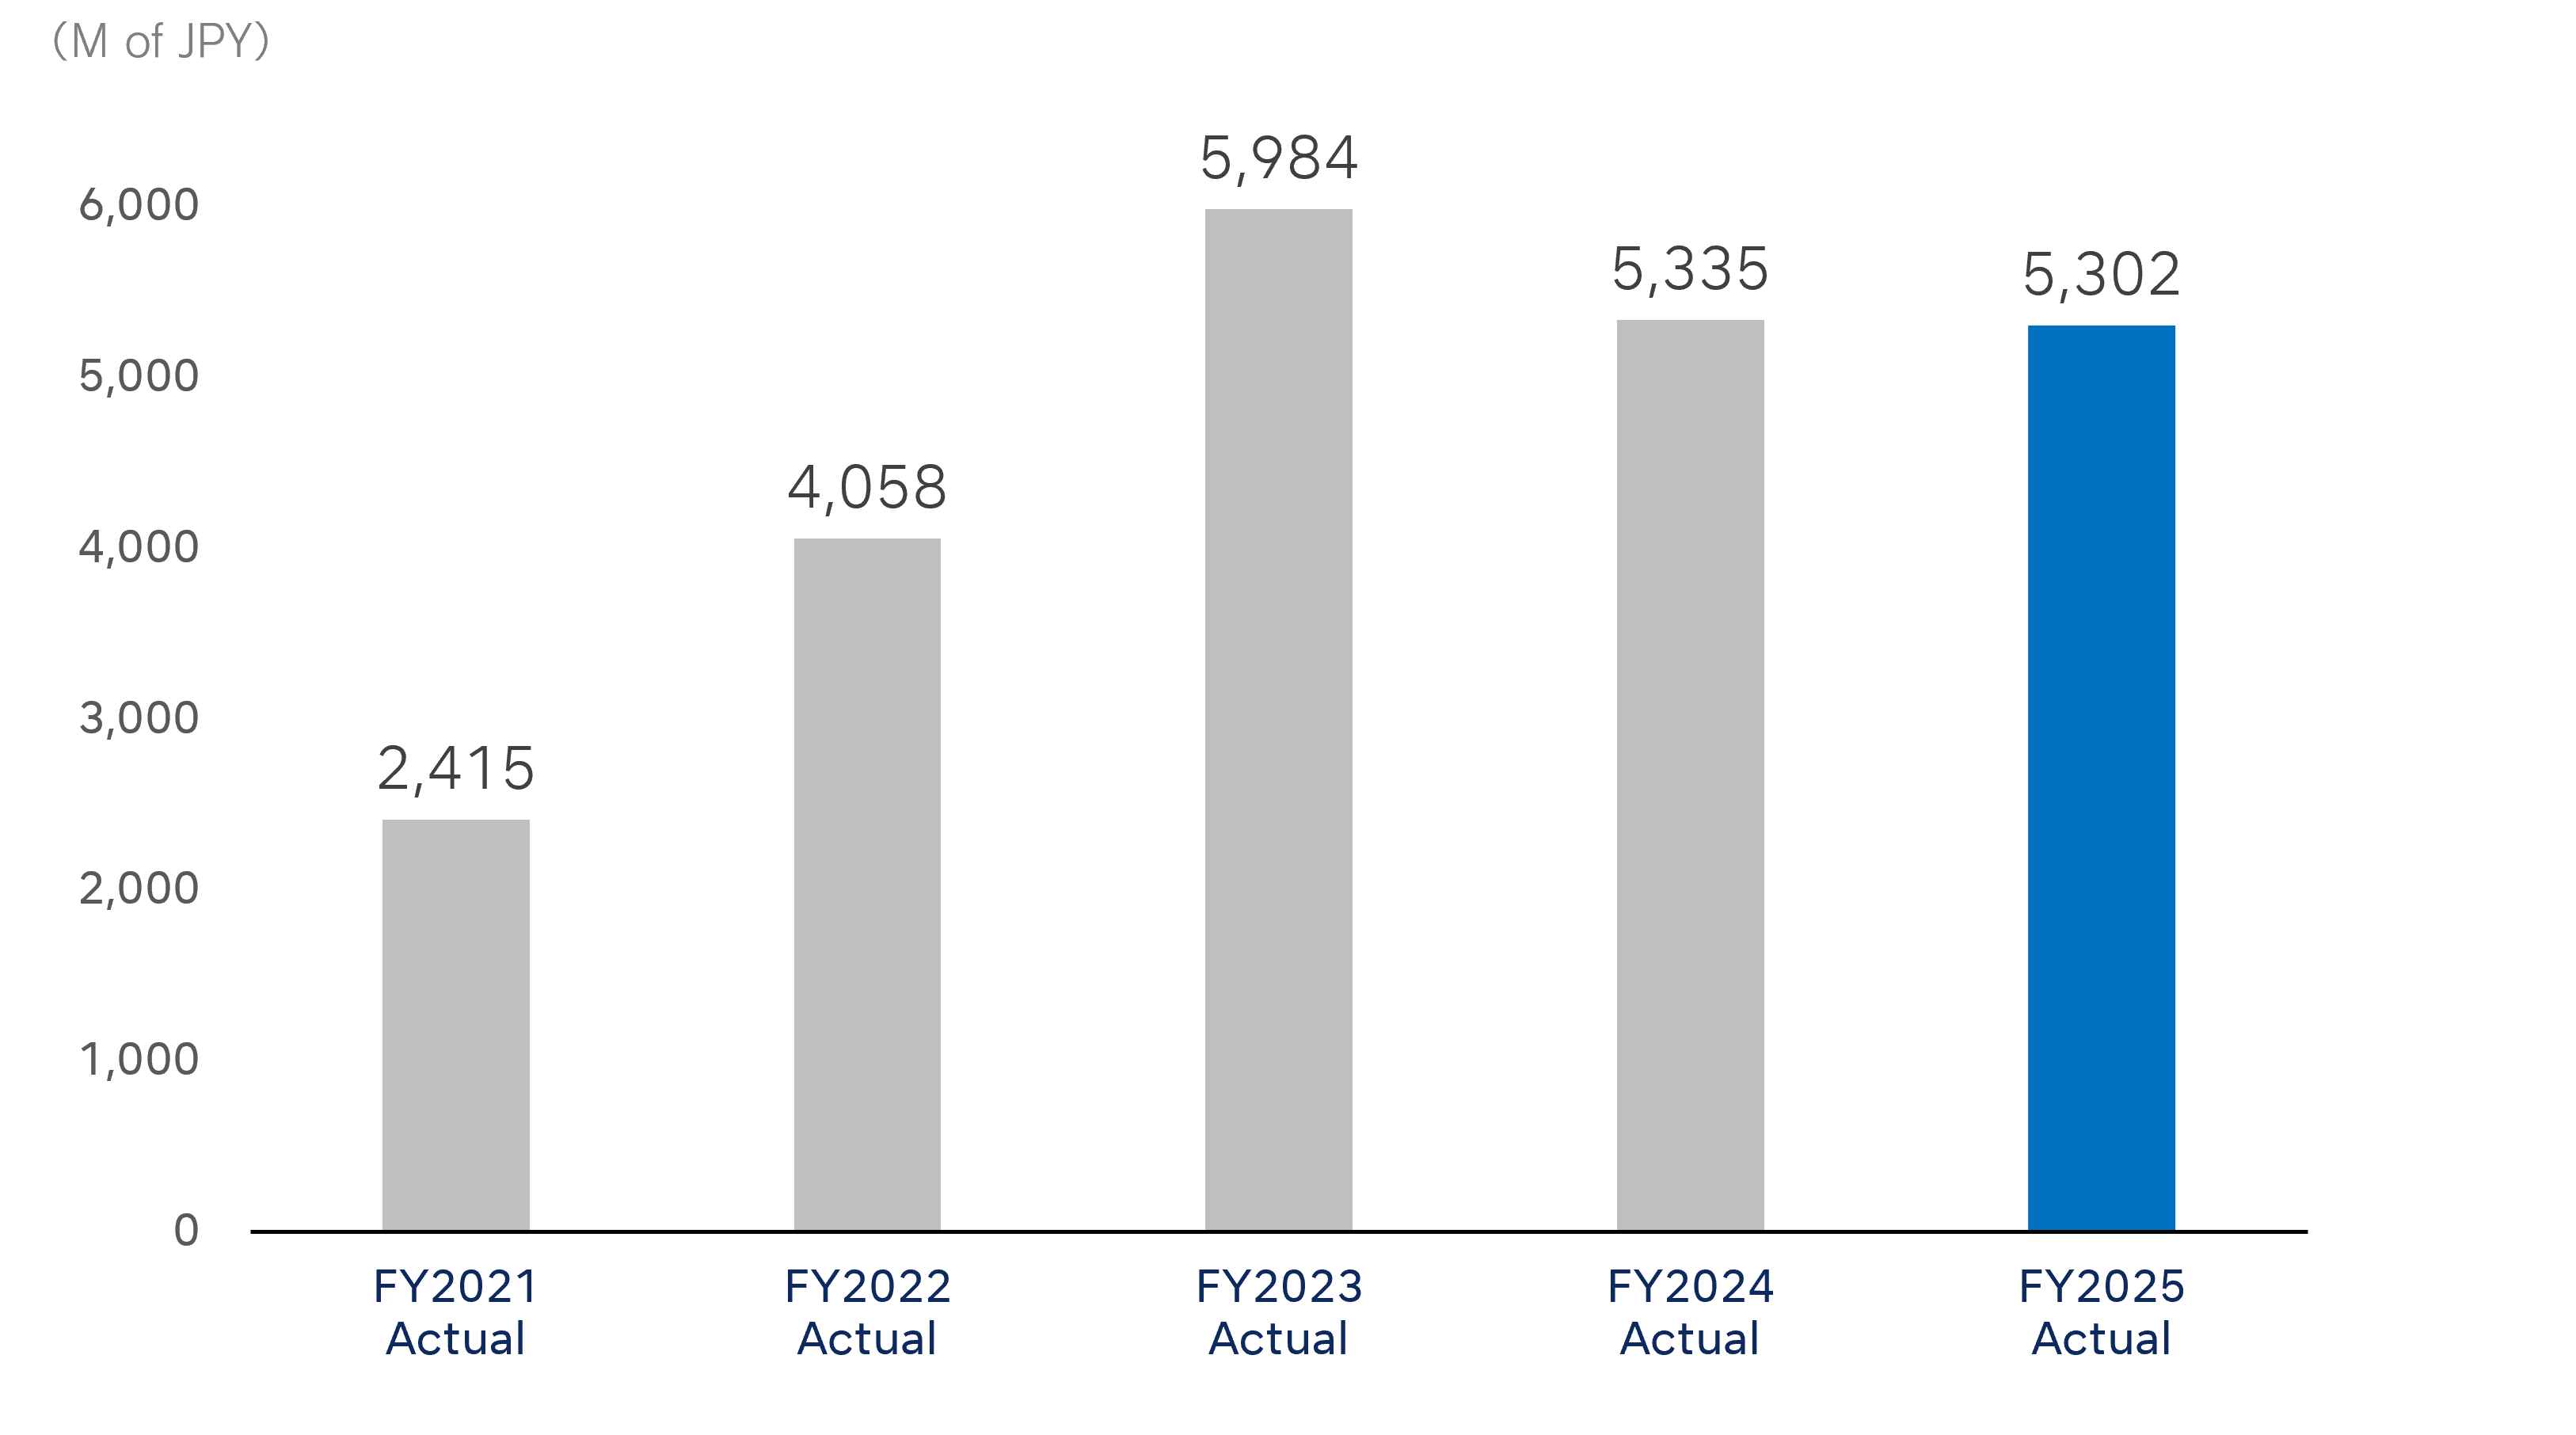
Capital investmentsMillions of JPY |
2,415 | 4,058 | 5,984 | 5,335 | 5,302 |
|
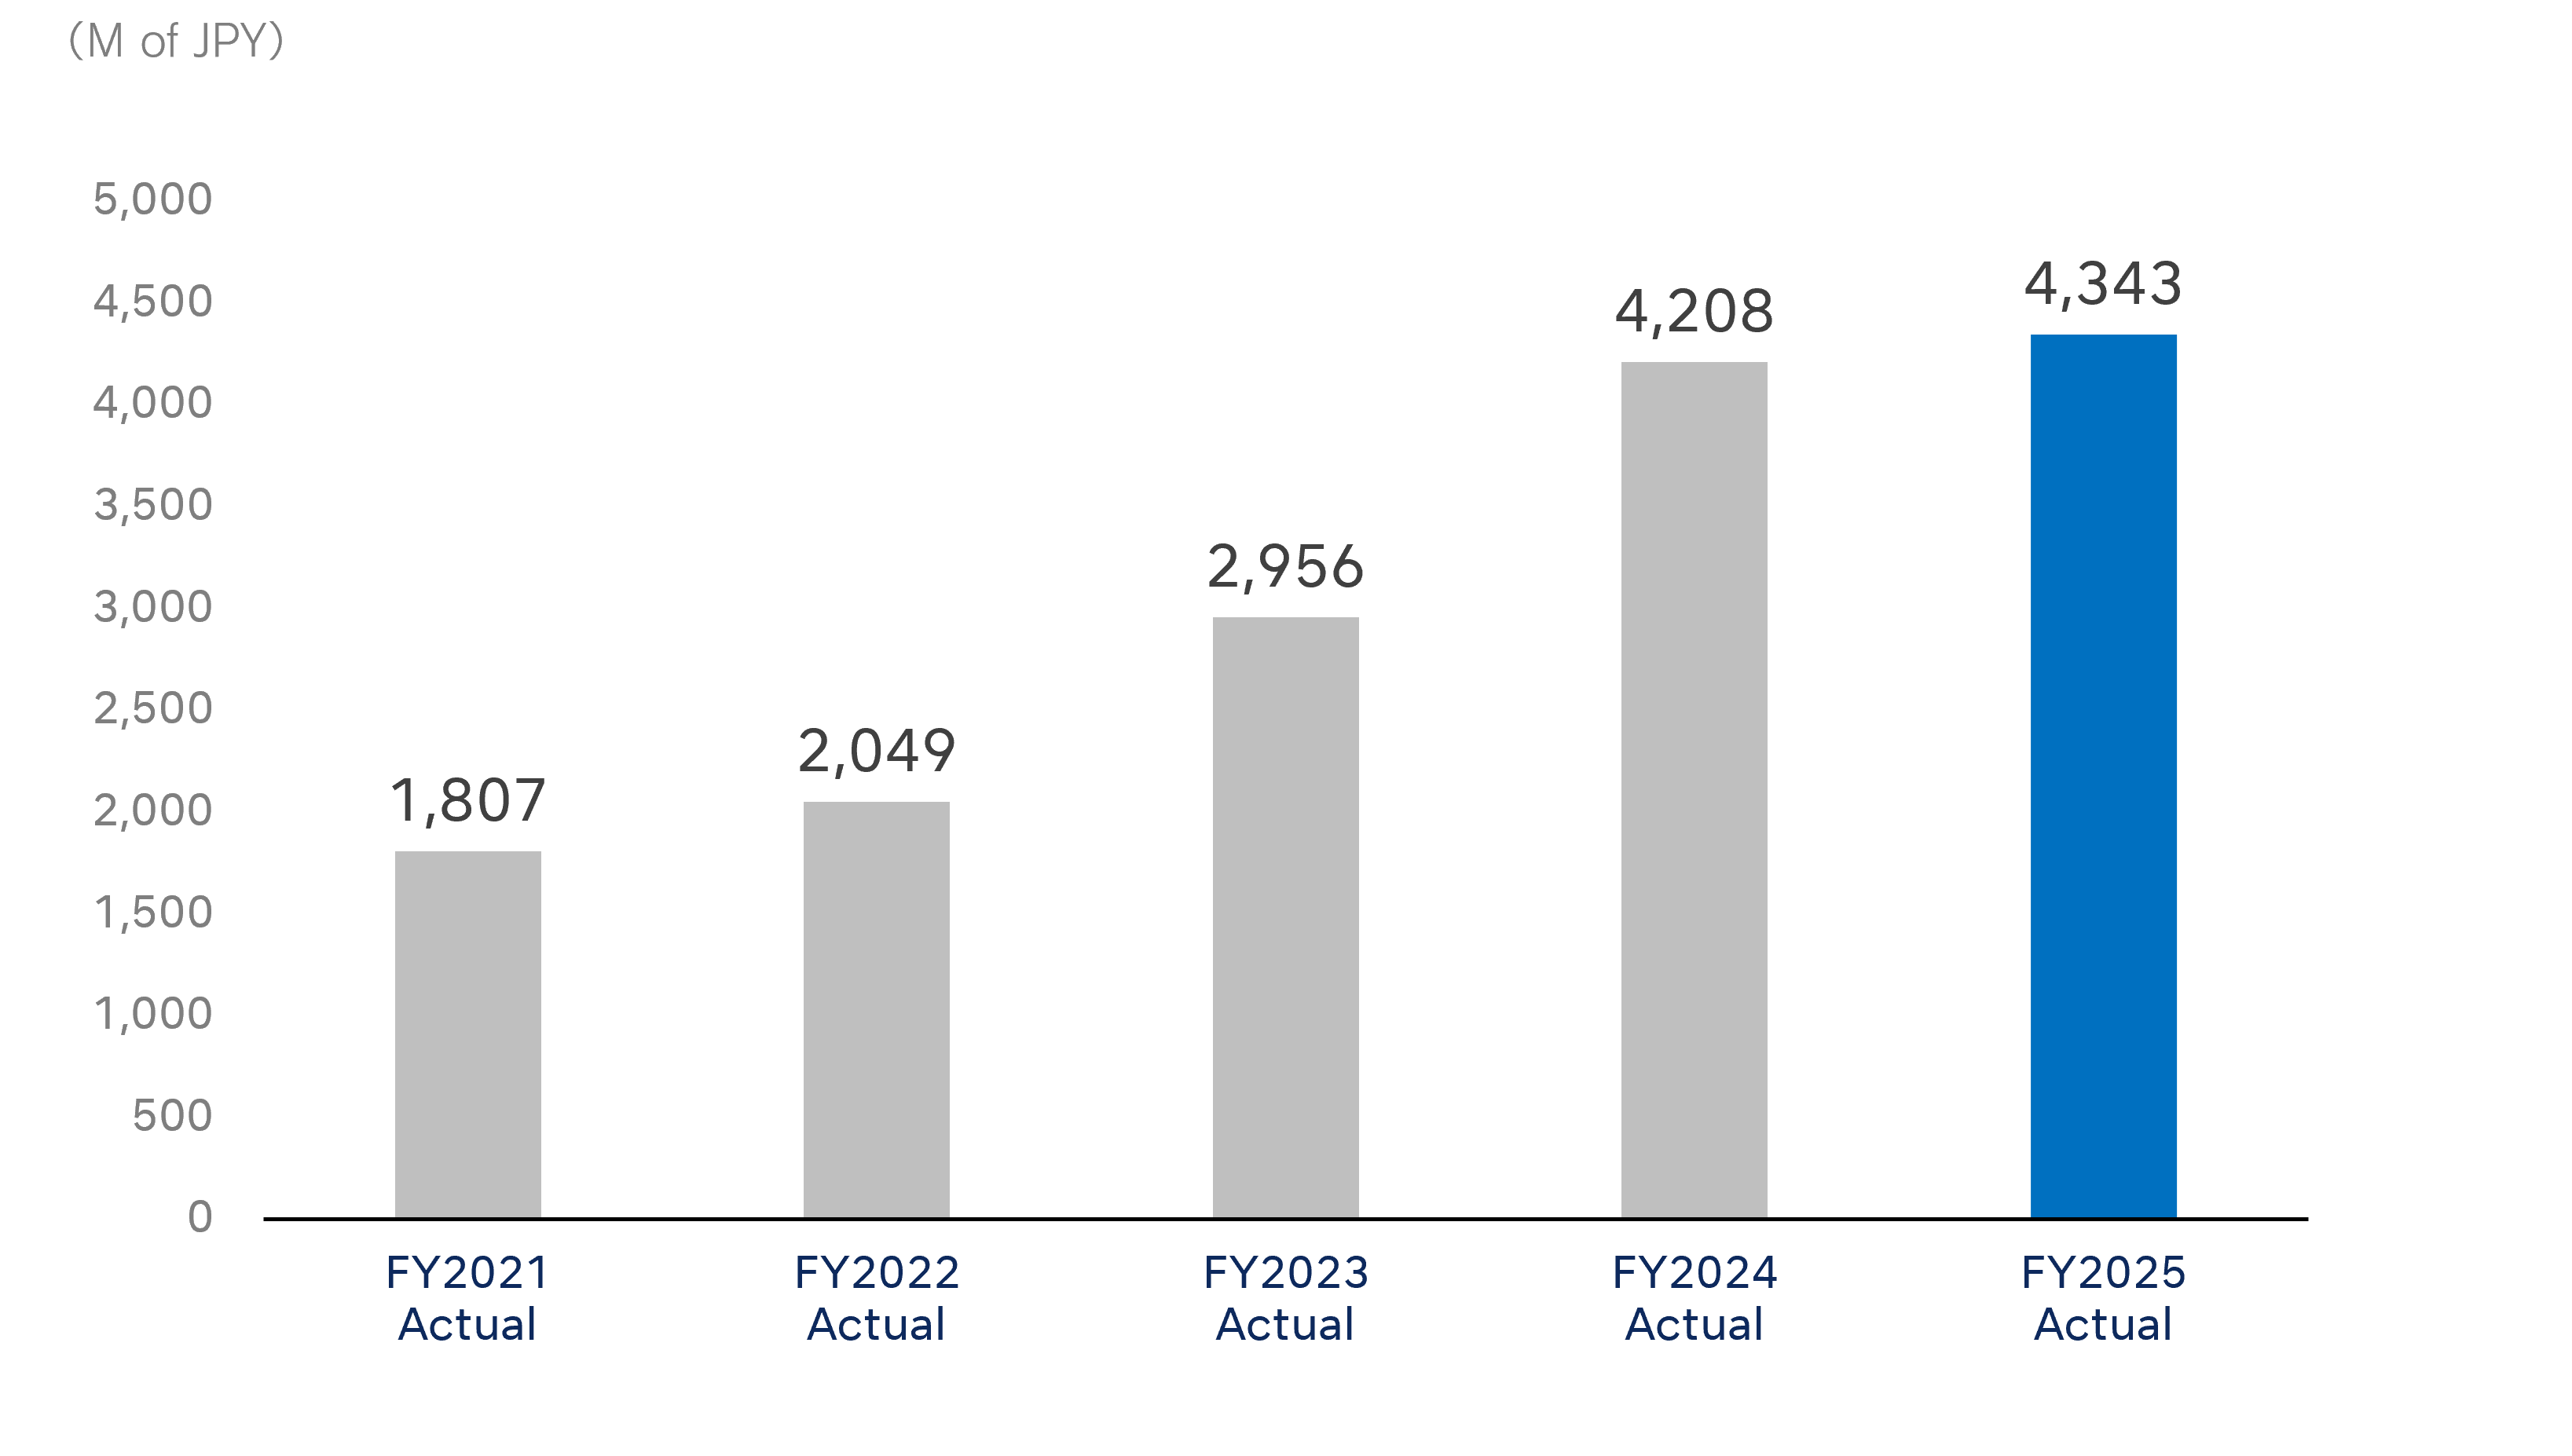
Depreciation expensesMillions of JPY |
1,807 | 2,049 | 2,956 | 4,208 | 4,343 |
|
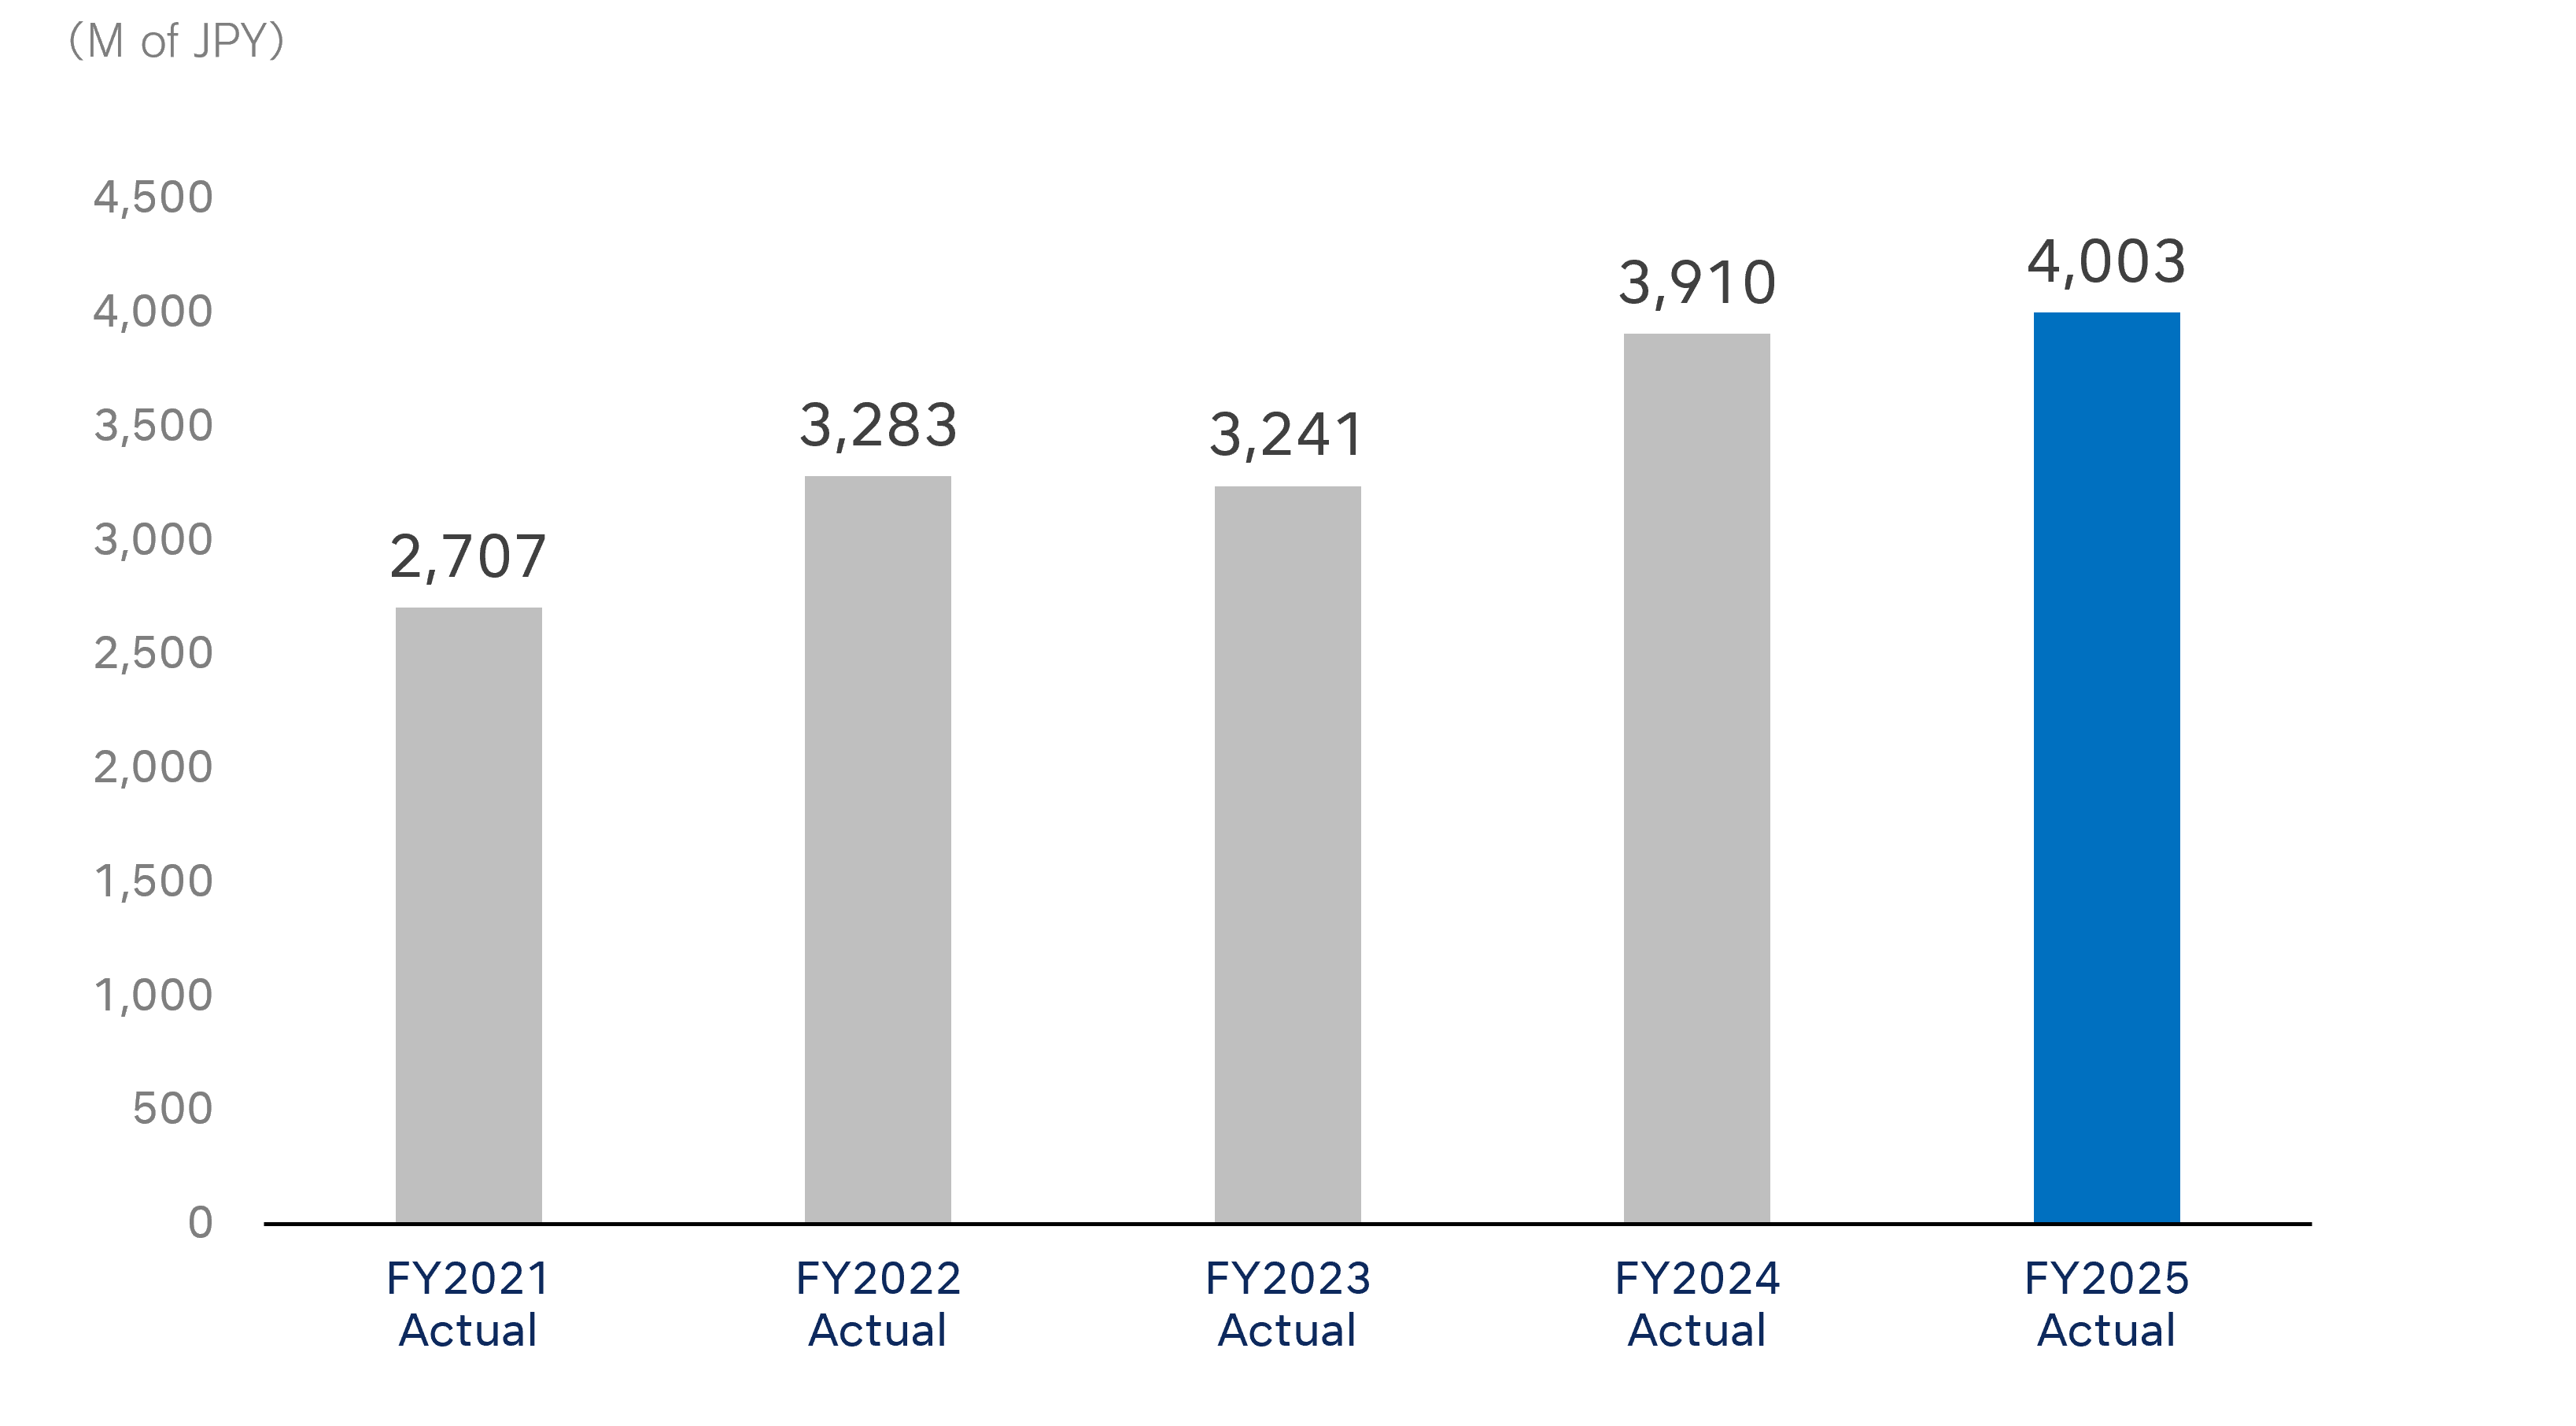
R&D expensesMillions of JPY |
2,707 | 3,283 | 3,241 | 3,910 | 4,003 |
|
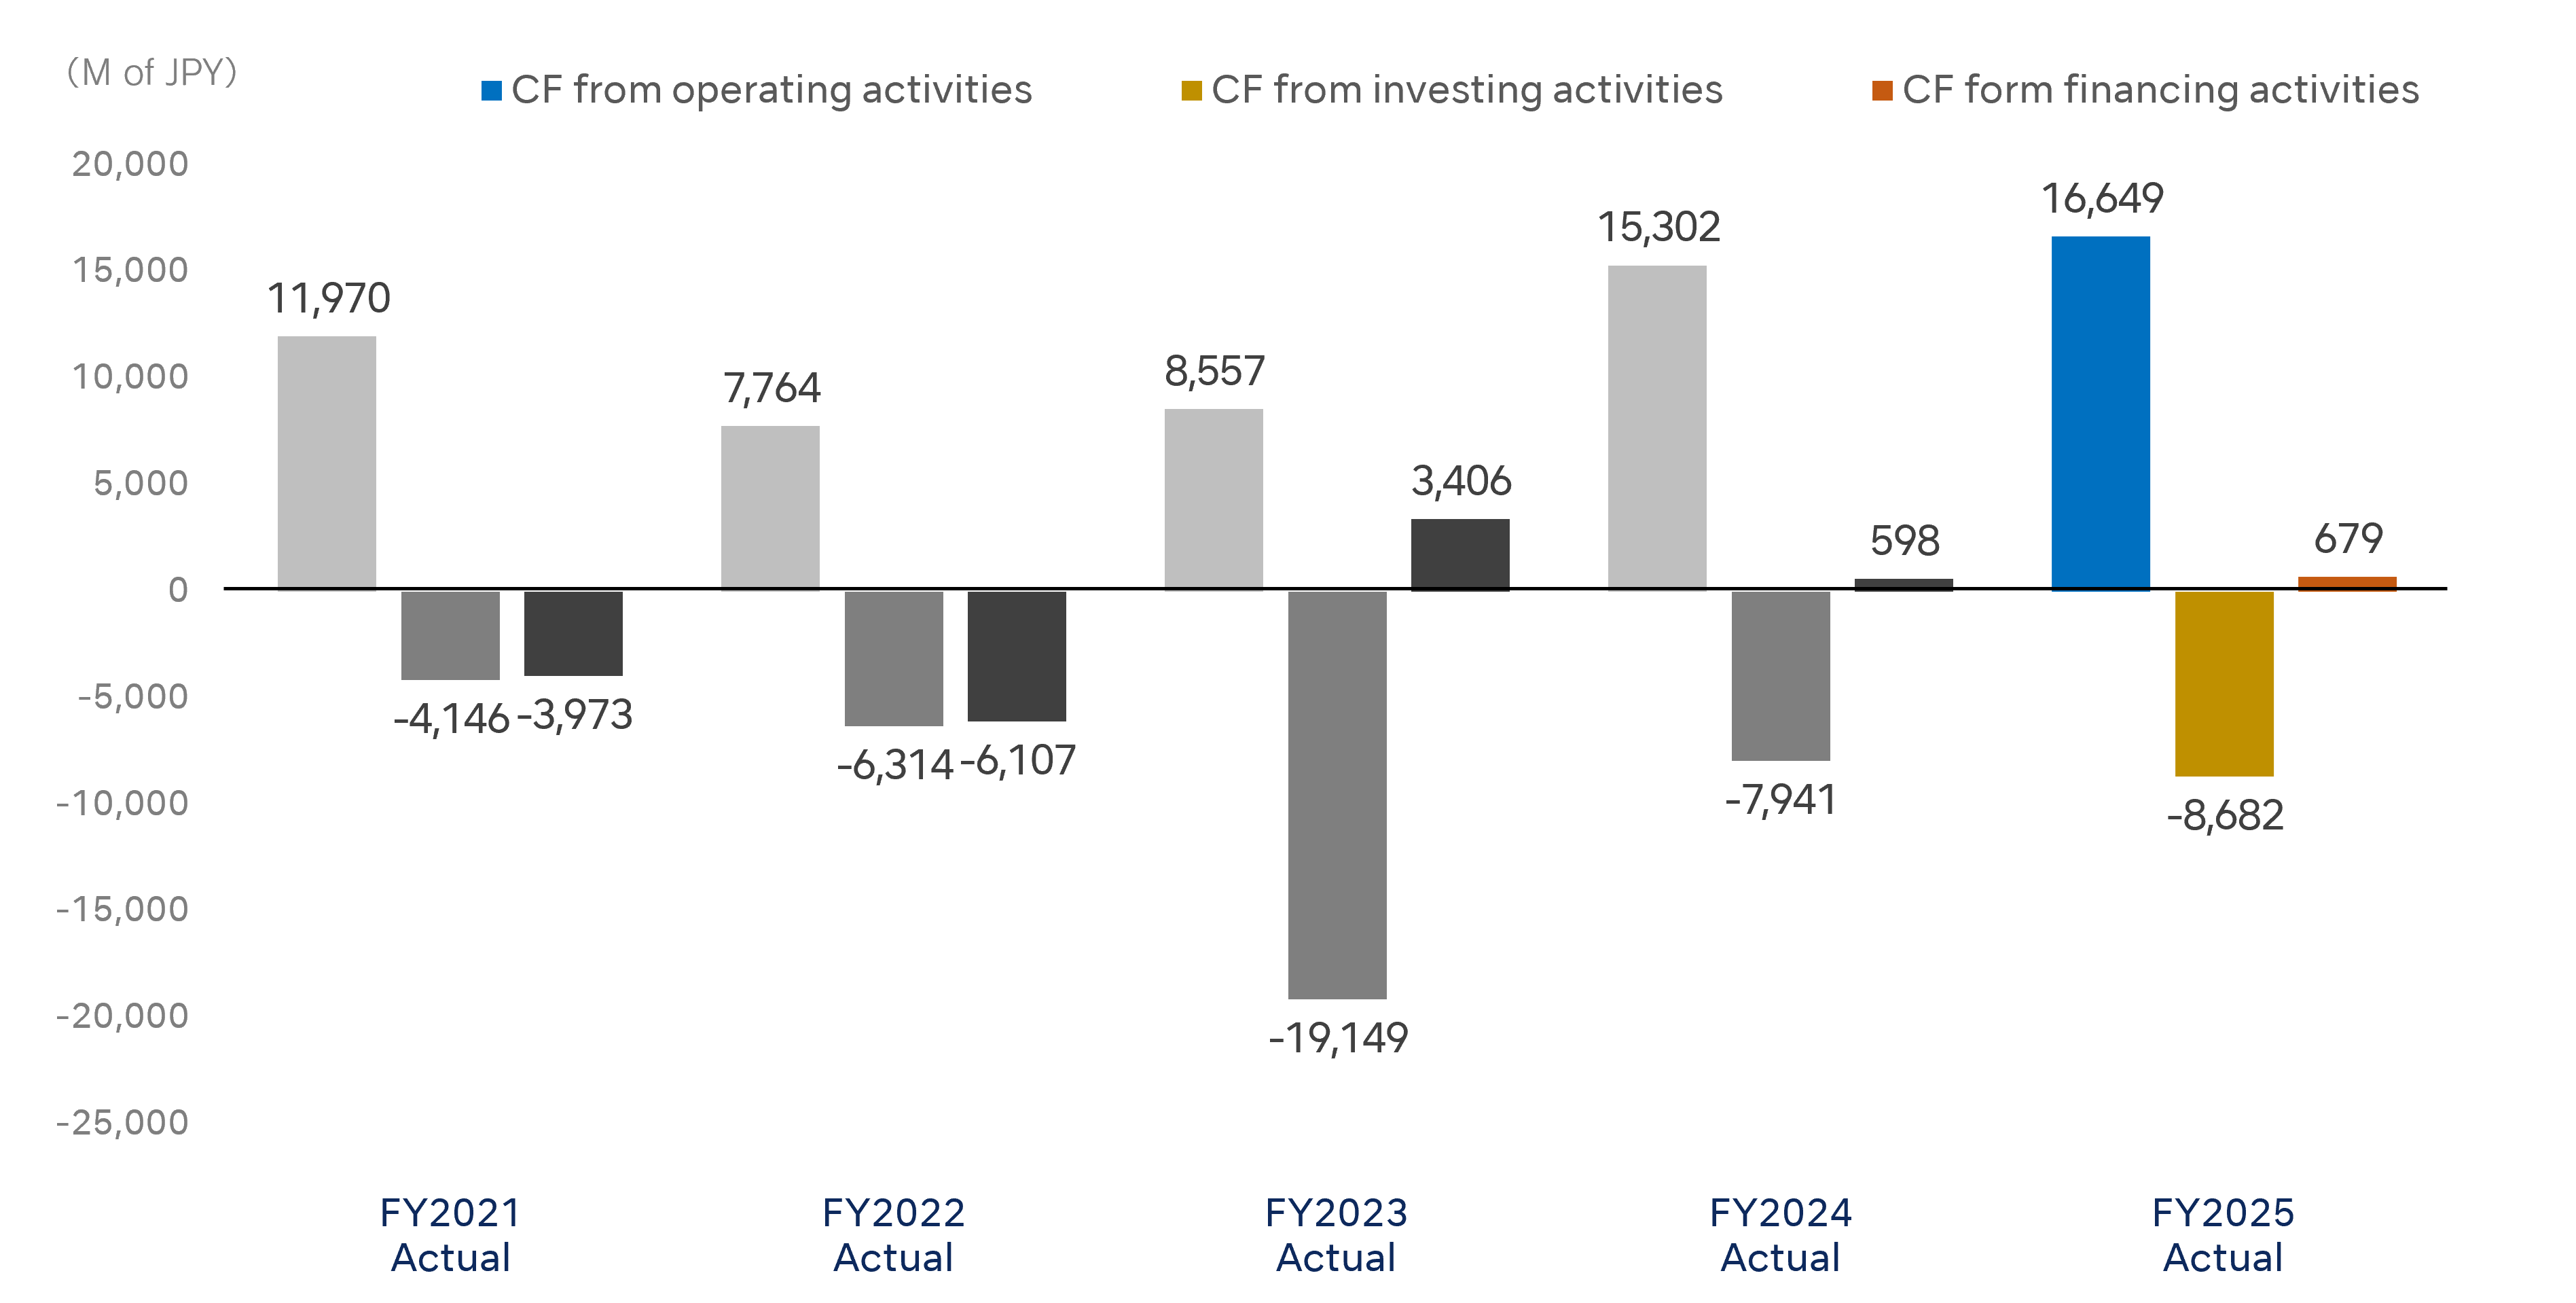
Cash flows from operating activitiesMillions of JPY |
11,970 | 7,764 | 8,557 | 15,302 | 16,649 |
|
Cash flows from investing activitiesMillions of JPY |
-4,146 | -6,314 | -19,149 | -7,941 | -8,682 |
|
Cash flows from financing activitiesMillions of JPY |
-3,973 | -6,107 | 3,406 | 598 | 679 |
Total assets / Net assets / Loans payable
Capital investments
Depreciation expenses
R&D expenses
Cash flows
Financial Position
| Consolidated financial results (JGAAP) | FY2021 Actual |
FY2022 Actual |
FY2023 Actual |
FY2024 Actual |
FY2025 Actual |
|---|---|---|---|---|---|
|
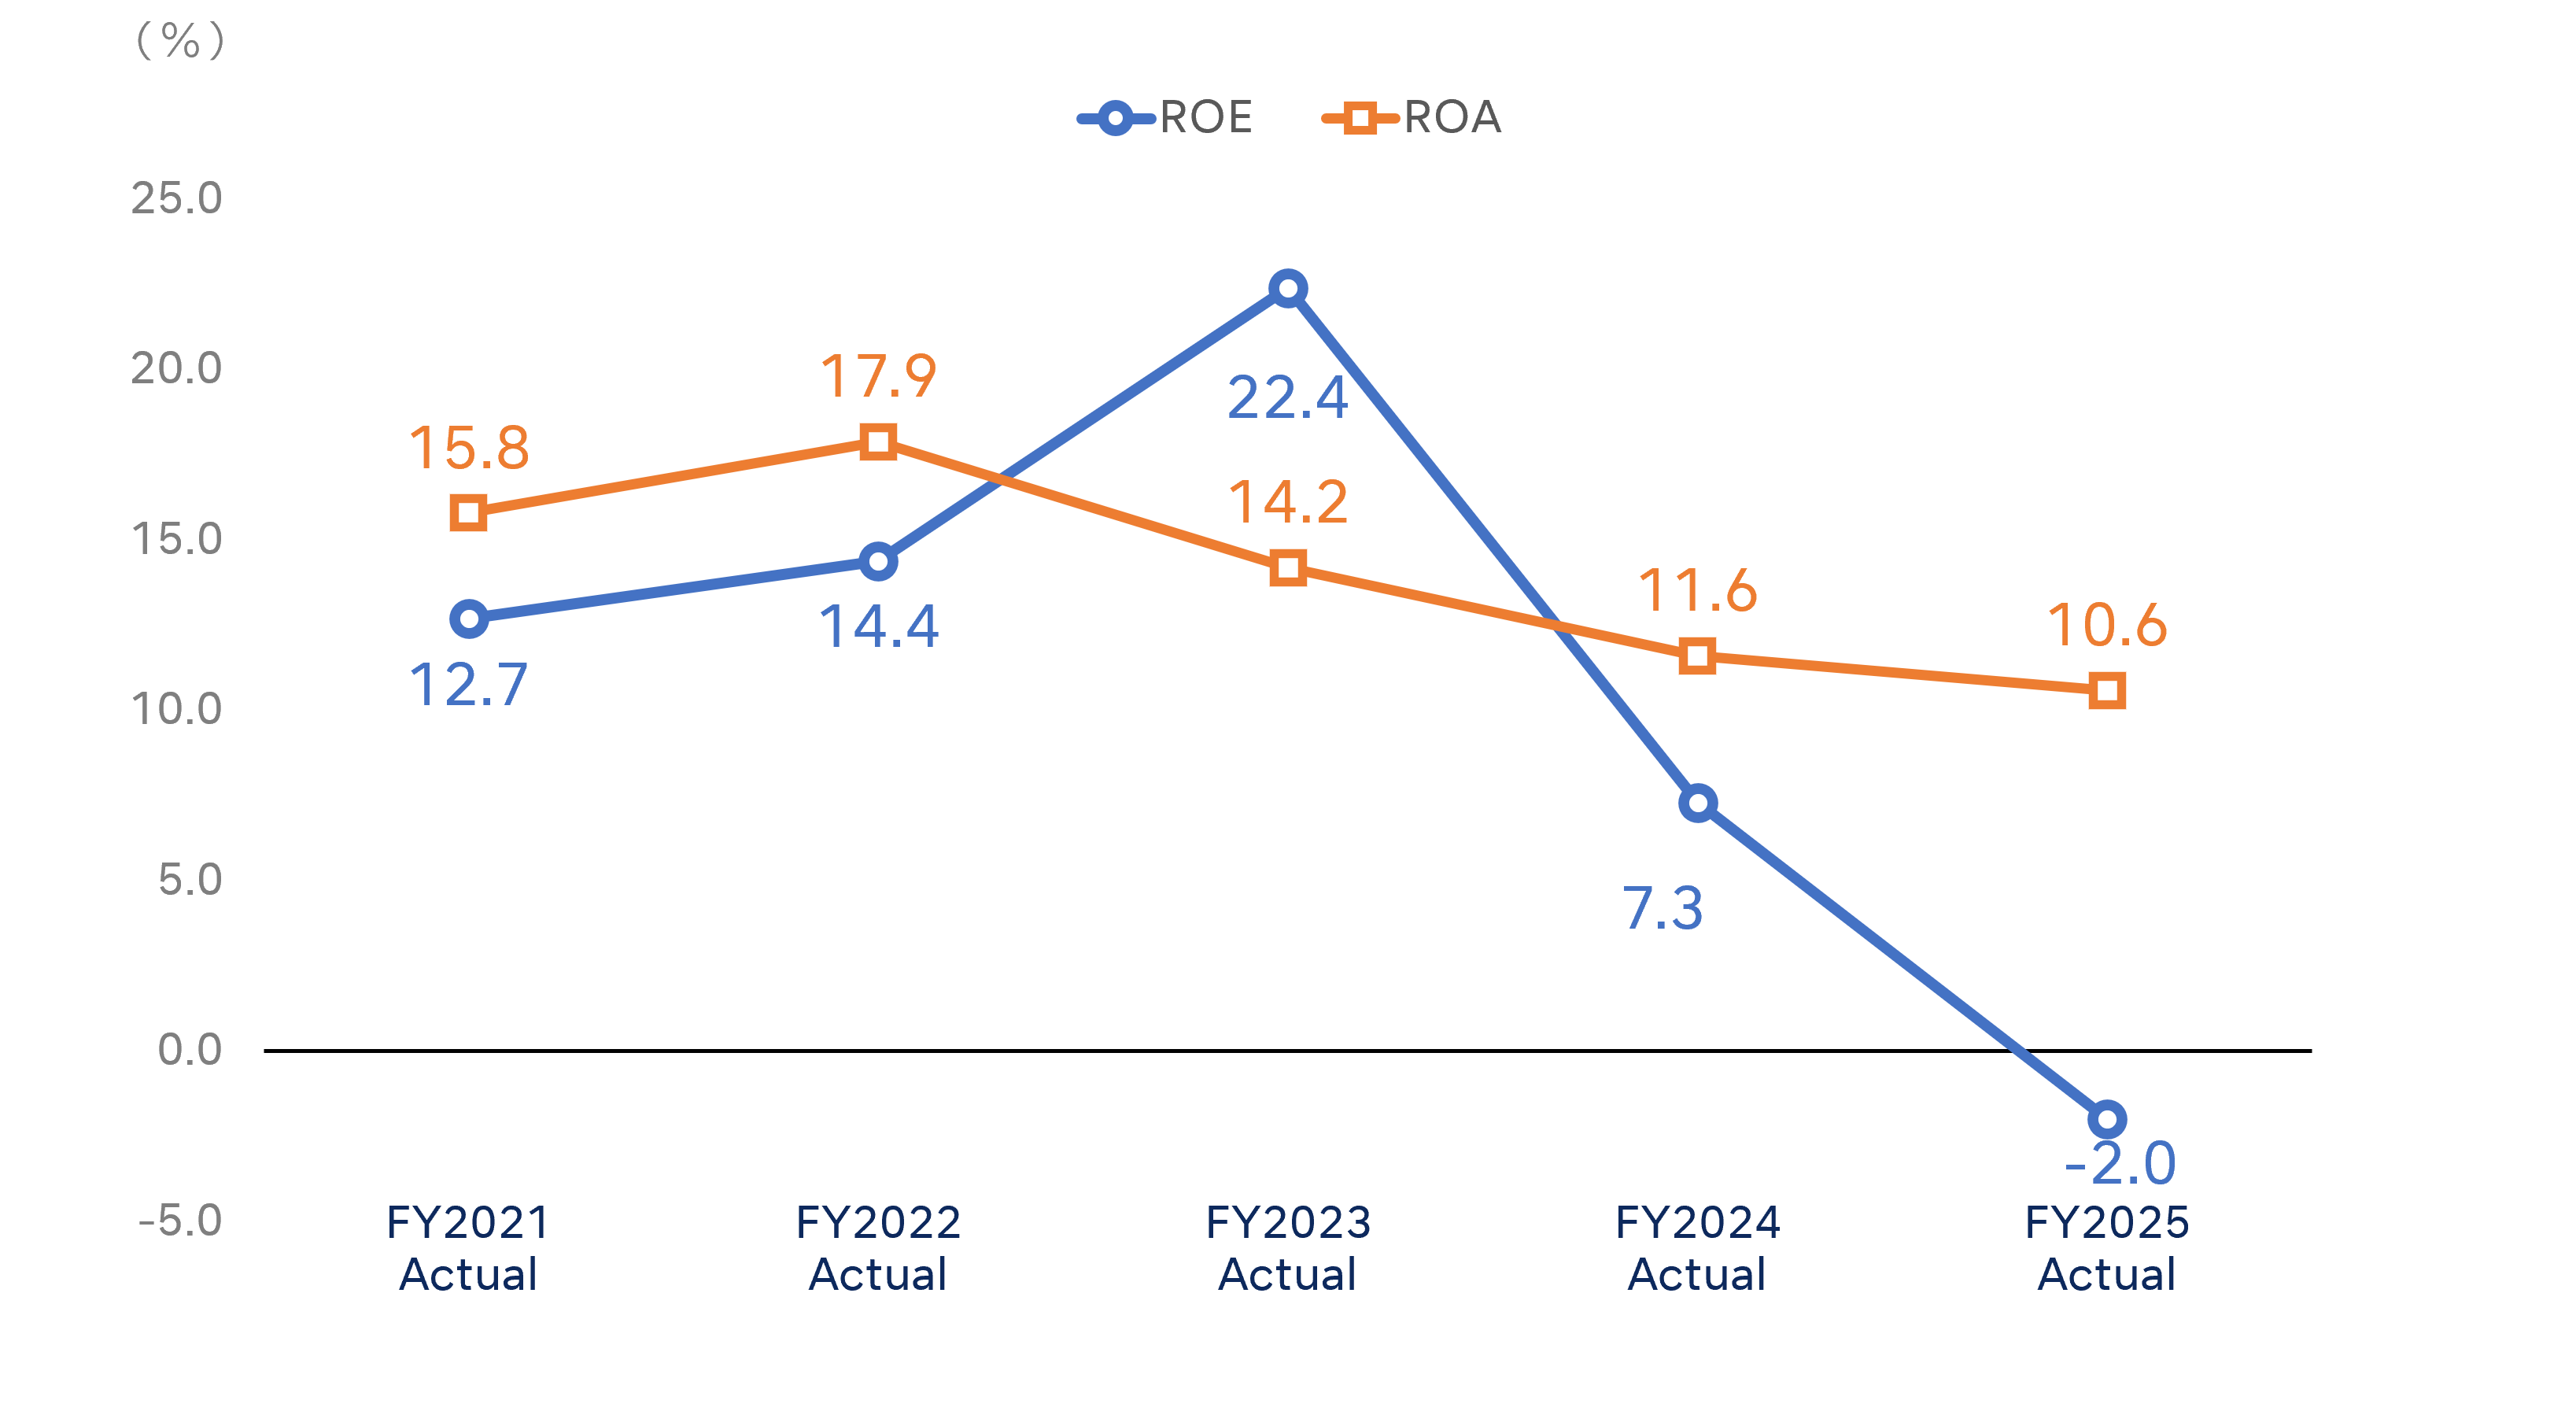
Return on equity (ROE) % |
12.7 | 14.4 | 22.4 | 7.3 | -2.0 |
|
Return on assets (ROA) % |
15.8 | 17.9 | 14.2 | 11.6 | 10.6 |
|
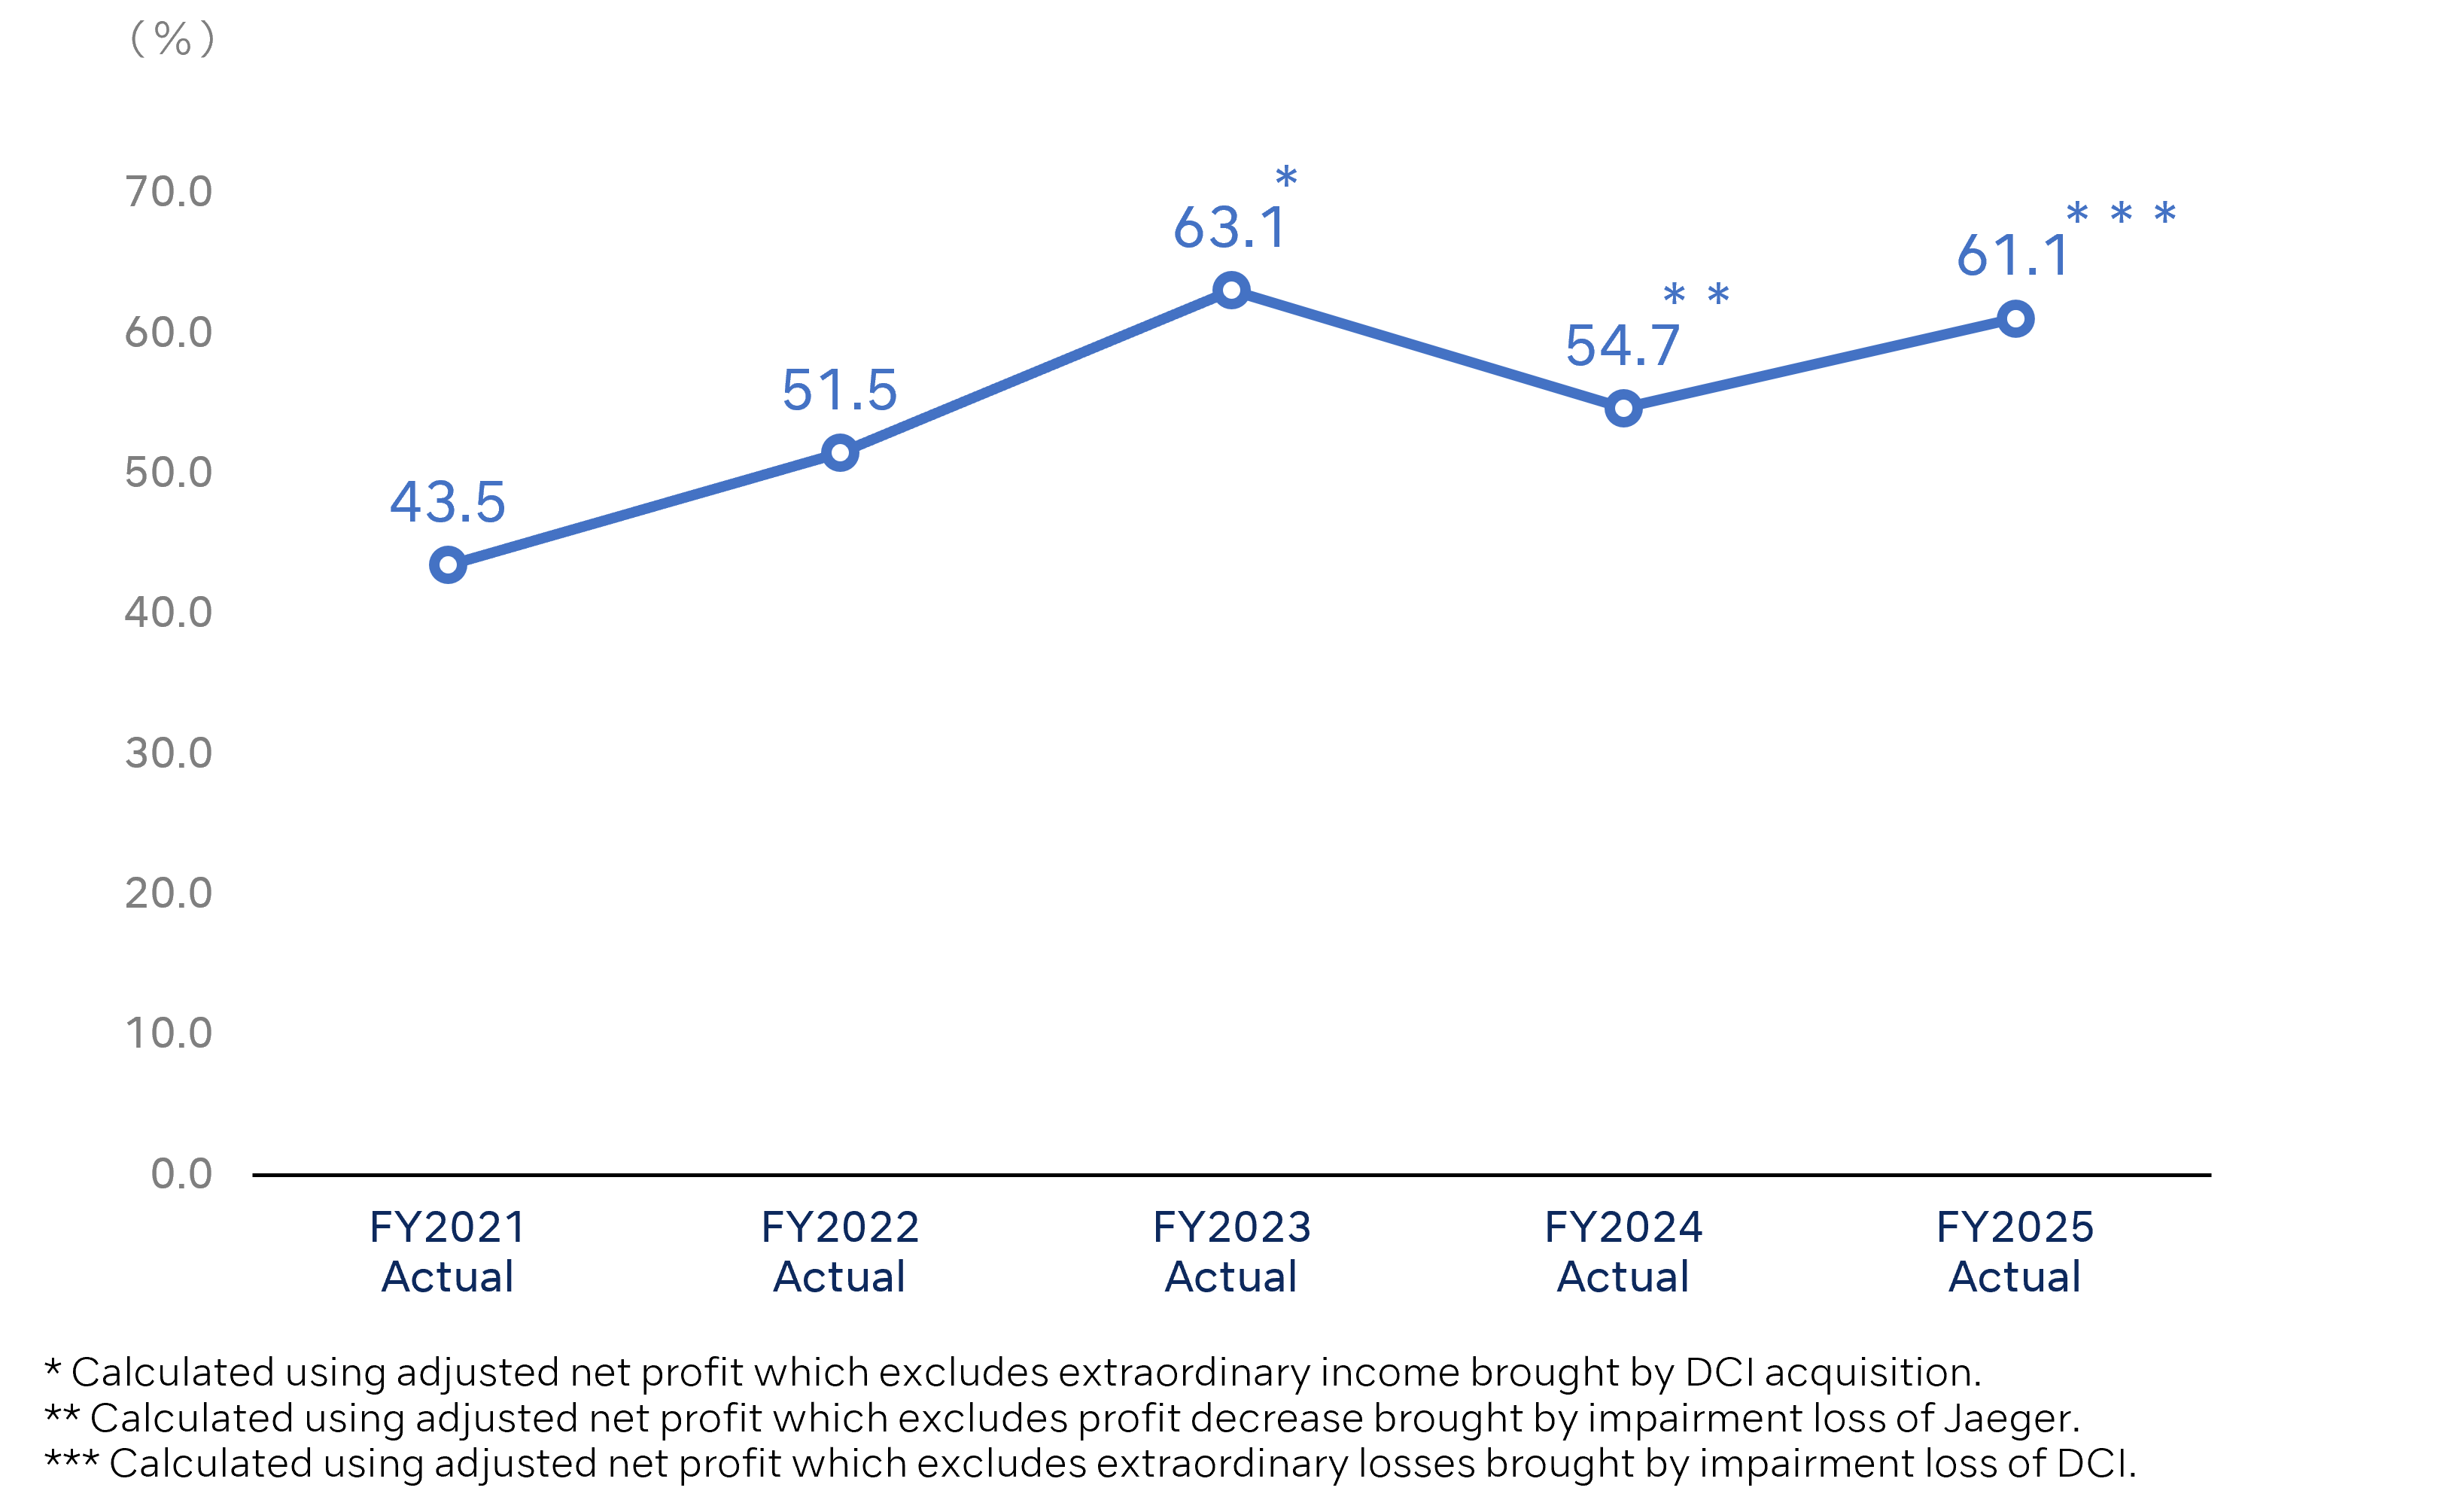
Total payout ratio % |
43.5 | 51.5 | 63.1 | 54.7 | 61.1 |
|
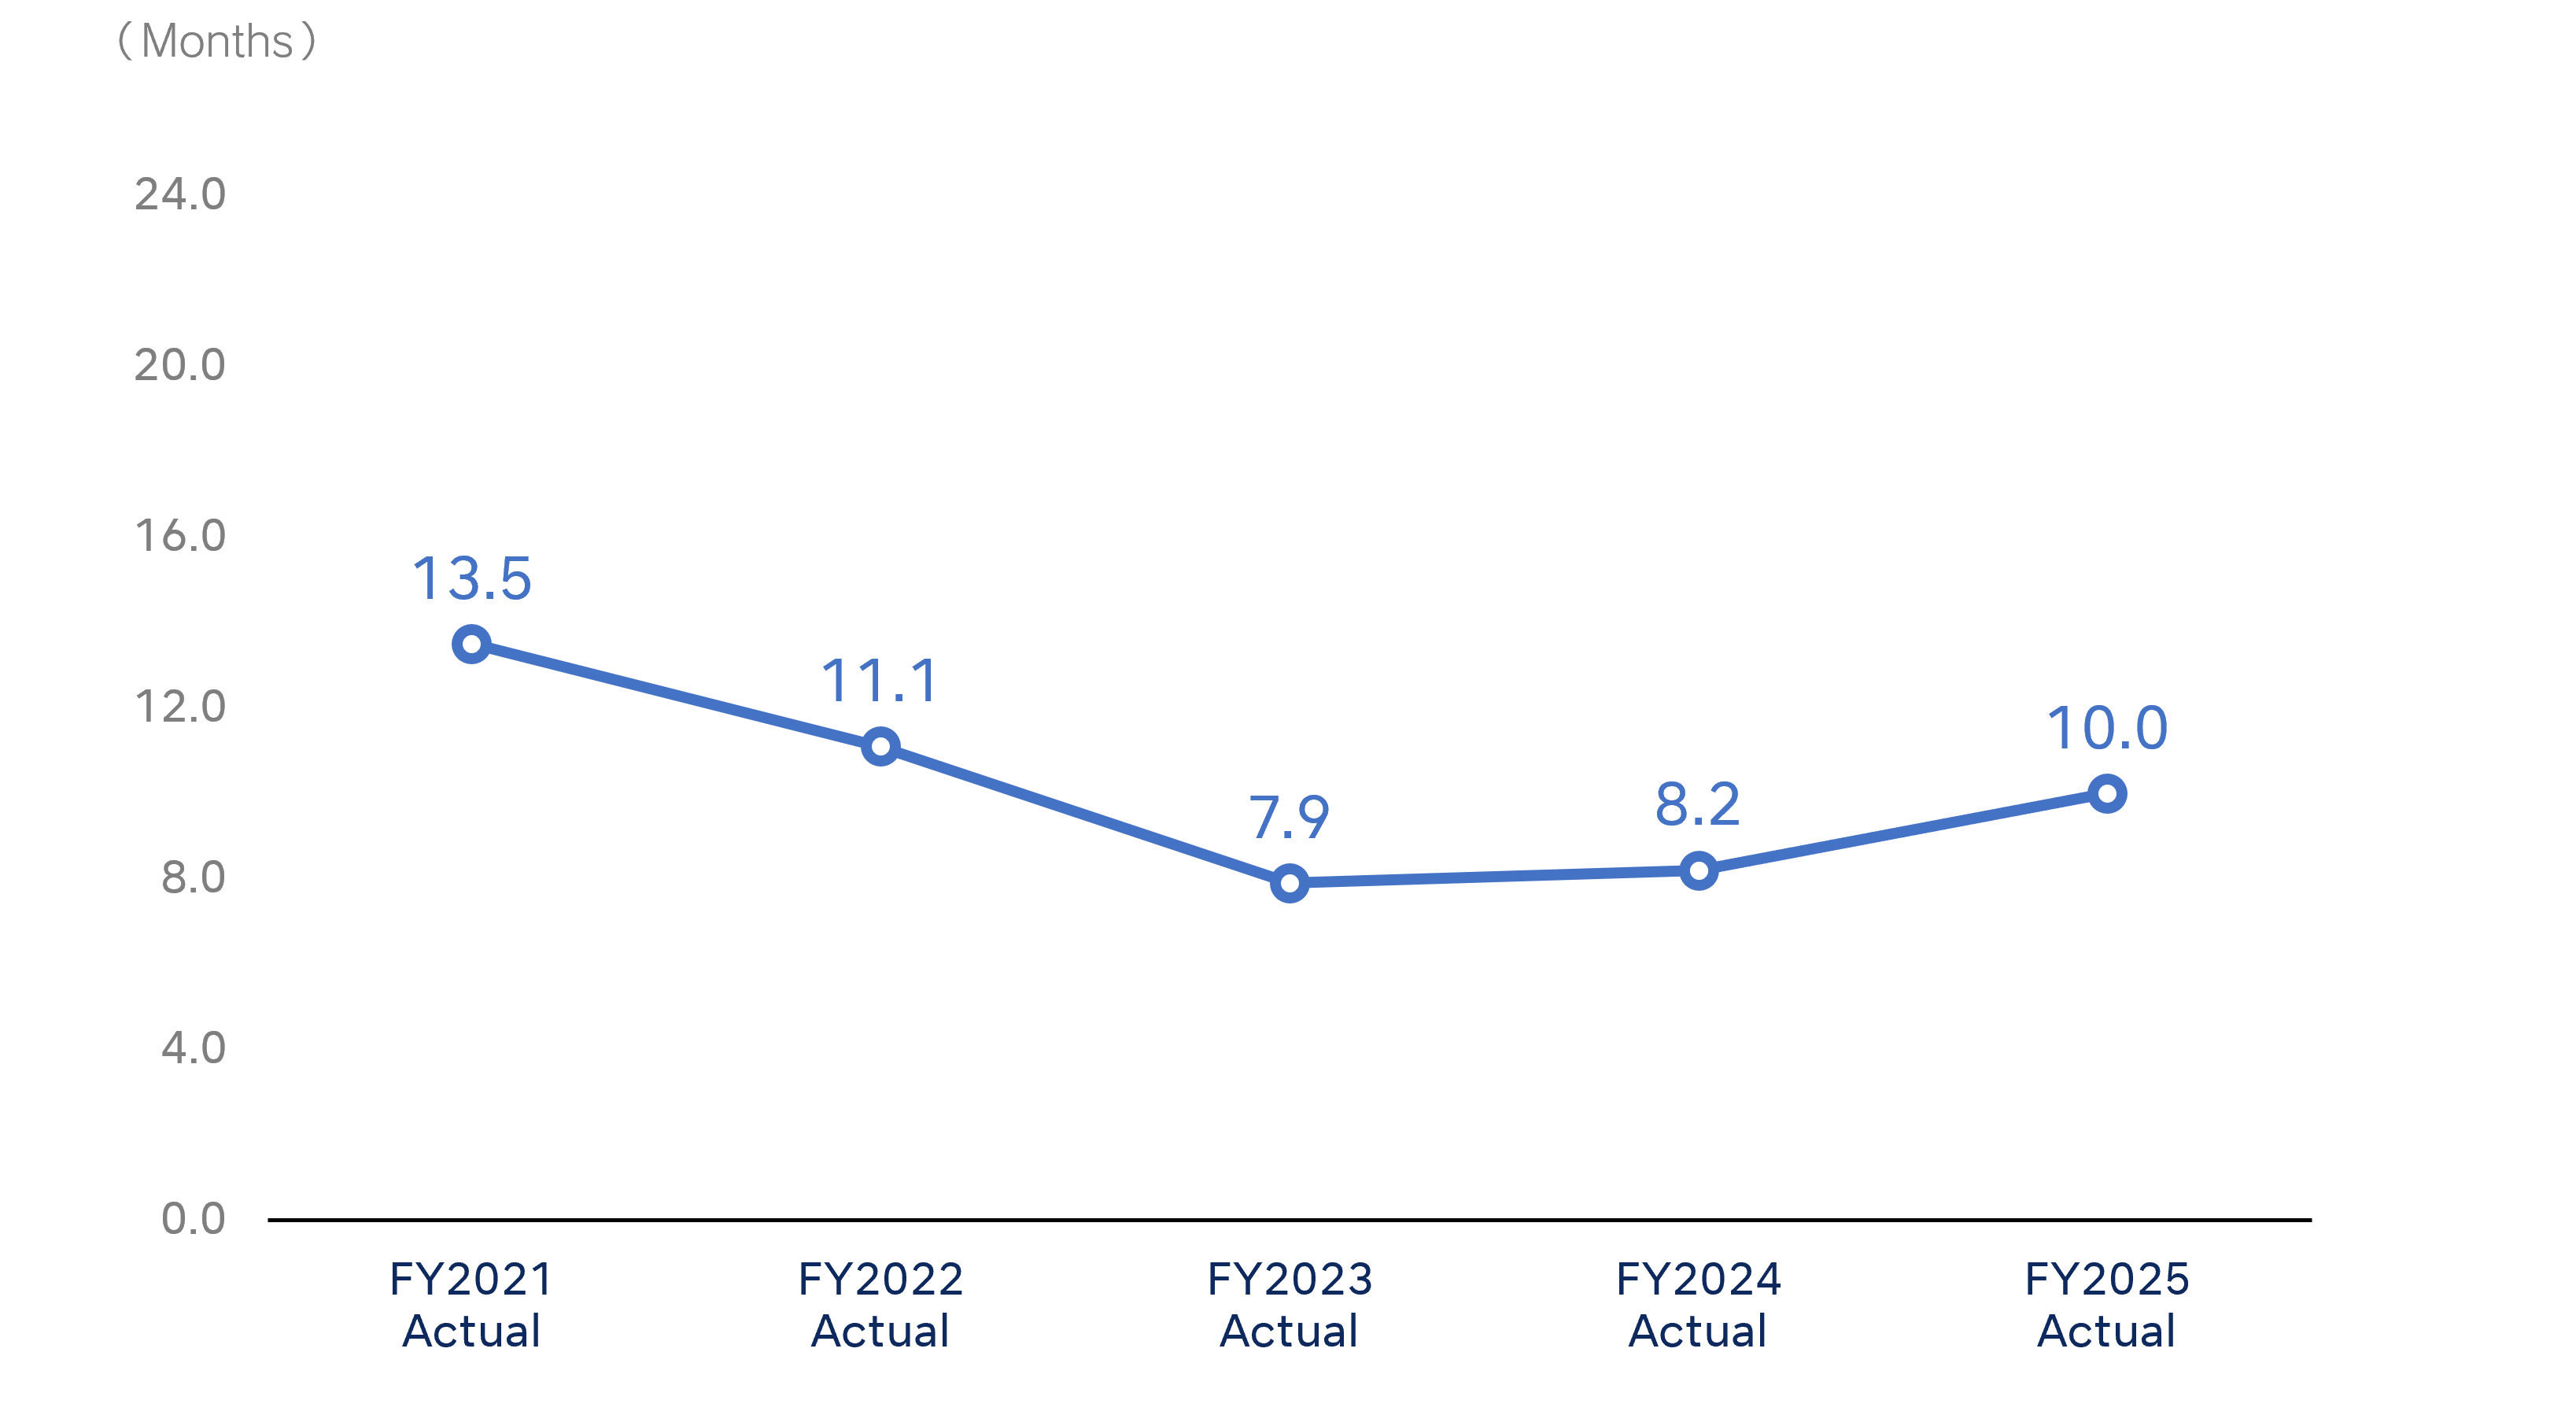
Cash & marketable securities to monthly sales ratio Months |
13.5 | 11.1 | 7.9 | 8.2 | 10.0 |
- ROE = Profit attributable to owners of parent / Average net assets
- ROA = Ordinary profit / Average total assets
- Total payout ratio = (Total annual dividend + Total amount of repurchase costs) / Profit attributable to owners of parent
- Cash & marketable securities to monthly sales ratio = (Cash + Money held in trust + marketable securities + Investment securities) / (Net sales / 12 months)
ROE・ROA
Total payout ratio
Cash & marketable securities to monthly sales ratio